Custom Indicator
You can send logs from the game or configure indicators using automatically collected logs and add them to analytics, in addition to the default indicators provided.
Following is the configuration sequence for indicators.
- Send logs after log definition
- This step is only required if the indicator is configured using game logs; if the indicator is configured using autonomously collected logs, this step is unnecessary.
- Confirm log
- Define data source
- Define source page
- Confirm the results of the indicator configuration
Definition and transmission of logs
To configure an indicator, the necessary configuration information must be stored in Analytics. This stage is required when configuring an indicator to transmit game logs directly. If you configure an indicator to collect data automatically, proceed to the next step.
To transmit logs from the game, define the schema in which the log will be stored using the log definition function.
Upon completion of log definition, log transmission must adhere to the specified format.
Using the ETL simulation function of the log definition function, you can transmit sample data if you wish to configure indicators prior to deploying log transmission to the server or client.
Confirm log
This is the step to review the required logs for configuring the indicator. With the data preview function of the log definition function, you can examine the data saved in each log.
For efficient data verification and subsequent processes, we recommend requesting Analytics Big Query permission to view logs directly.
Define data source
To configure an indicator, a data source must be specified. BigQuery data queries are accessible via the Console > Analytics > Management > Data Source menu and require SQL.
You can write the SQL necessary for the data source by requesting the Analytics Big Query permission described in the previous step.
Sequence of source data generation
- Select “Register Data Source” from the menu.
- Click Next after entering the required data source name, date classification, and SQL Query fields.
- Data source name: A descriptive name for the data source.
- Date classification: This setting applies the specified date value when searching for a date in an indicator using SQL. According to the SQL date search type, a value must be selected, and depending on the selected value, the date value set in the indicator is transmitted to the reserved word specified in the SQL Query WHERE clause.
- Daily: When searching for a specific number of days
- Monthly: When searching for a specific number of months
- Previous day: If a single-day search is conducted, the indicator’s default date is set to yesterday upon initial access
- Today: When searching for only one day, the default date is today when accessing the indicator for the first time
- Manual setting: When not using the date search feature for the indicator
- Database: Choose BIGQUERY.
- SQL Query: Consider the following when writing Big Query SQL to query the data to be exposed to the indicator.
- datetime is a timestamp data type and represents the log’s date value. To avoid degrading performance, care must be taken not to alter the timestamp data type.
E.g.) Change and non-change of a data type
| Case 1) Incorrect example of data type change | where date(datetime) >= '2023-08-01' |
| Case 2) Correct example where data type does not change | where TIMESTAMP_TRUNC(dateTime, DAY) >= '2023-08-01' |
where TIMESTAMP_TRUNC(dateTime, MONTH) >= '2023-08' |
-
-
- If you want to convert to a time zone other than UTC, use the timestamp_add function on the date value of the search condition instead of the datetime field.
-
E.g.) Search for August 1, 2023, based on KST
| Subtract nine hours from KST and compare to the search range | where datetime >= timestamp_add('2023-08-01', interval -9 hour) and datetime < timestamp_add('2023-08-02', interval -9 hour) |
where datetime >=timestamp_add('2023-08-01', interval -9 hour) and datetime < timestamp_add(timestamp_add('2023-08-01', interval -9 hour), interval 1 day) |
-
-
- Specify the date value in the WHERE clause based on the selected date classification.
-
| Daily | UTC | where datetime >= TIMESTAMP('##FROMDT##') and datetime < timestamp_add(TIMESTAMP('##TODT##'), interval 1 day) |
| KST | where datetime >= timestamp_add('##FROMDT##', interval -9 hour) and datetime < timestamp_add(timestamp_add('##TODT##', interval -9 hour), interval 1 day) |
|
| Monthly | UTC | where dateTime >= TIMESTAMP(concat('##FROMMM##','-01')) and dateTime < TIMESTAMP(datetime_add(date(concat('##TOMM##','-01')),interval 1 month)) |
| KST | where dateTime >= timestamp_add(TIMESTAMP(concat('##FROMMM##','-01')), interval -9 hour) and dateTime < timestamp_add(TIMESTAMP(datetime_add(date(concat('##TOMM##','-01')),interval 1 month)), interval -9 hour) |
|
| Previous day/Today | UTC | where datetime >= TIMESTAMP('##TODAY##') and datetime < timestamp_add(TIMESTAMP('##TODAY##'), interval 1 day) |
| KST | where datetime >= timestamp_add('##TODAY##', interval -9 hour) and datetime < timestamp_add(timestamp_add('##TODAY##', interval -9 hour), interval 1 day) |
|
| Manual setting | It is not required because the search date value of the indicator is not transmitted, but it is recommended for query performance to include a datetime field in the WHERE clause. Below is an example of utilizing UTC/KST to observe logs from 12am yesterday to the present. |
|
| UTC | where datetime >= TIMESTAMP_TRUNC(timestamp_add(current_timestamp(), interval -1 day), DAY) |
|
| KST | where datetime >= timestamp_add(TIMESTAMP_TRUNC(timestamp_add(current_timestamp(), interval -1 day), DAY) , interval -9 hour) |
|
-
-
- The top-level SELECT clause must include at least one axis to be exposed by the indicator and at least one field to be used as a value, with the field’s alias defined in lowercase letters. Additionally, there must be spaces between fields.
-
E.g.) SELECT example
| Case 1) Incorrect example | SELECT * | Missing field name |
| SELECT yyyymmdd,dau | Missing spacing between fields | |
| SELECT YYYYMMDD | Capitalize field names | |
| Case 2) Correct example | SELECT yyyymmdd, dau | |
| SELECT yyyymmdd, game, value as dau | ||
-
-
- The data type of fields to be exposed as values must be numeric.
- There must be no spaces preceding or following the SQL.
- The NUMERIC format is not supported, so conversion to CAST is necessary.
- The table name in the FROM clause must be specified in the format “##companyDataset##.tablename“.
- If a custom indicator is added to the game-specific indicators, the indicator can be displayed in the game-specific indicators based on the selected game. If you include a query for ##appidGroup## in the SQL WHERE clause, the selected game in the game-specific indicator will be entered automatically when querying.
- E.g.) WHERE appidGroup in (‘##appidGroup##’)
-
- Click Next after specifying the axis selection and value selection for each item.
- All Items: The fields stated in the top-level SELECT clause specified in the preceding SQL Query.
- Axis selection: To configure rows and columns while configuring an indicator, drag and drop the field. To modify the name displayed on the indicator, type “Change Name” in Korean or English (uppercase/lowercase) without spaces.
- Select value: To show the value corresponding to each axis when revealing an indicator, drag and move the field. Radio controls permit the configuration and selection of multiple value selections. To modify the name displayed on the radio icon, type “Change Name” in Korean or English (uppercase/lowercase) without spaces.
- If alignment of axis items is required, set it, then select Next and OK to save the data source. The sorting order can be set to ascending or descending.
Define page source
To configure the indicator, a page source must be specified. It is accessible via the “Console > Analytics > Management > Page Source” menu and requires a data source from the preceding stage.
Page source creation order
- Click the “Register Page Source” button.
- After configuring the items for the indicator, select Next.
- Page title :A name to designate the page source, used as the indicator’s tab menu.
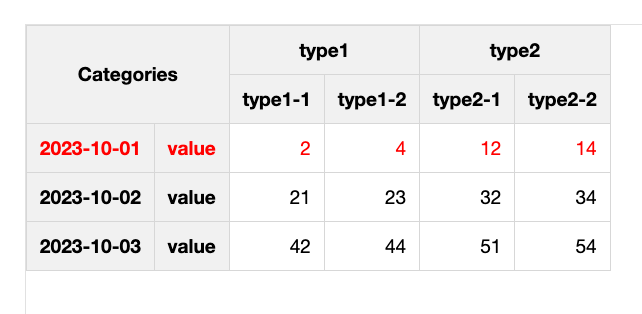
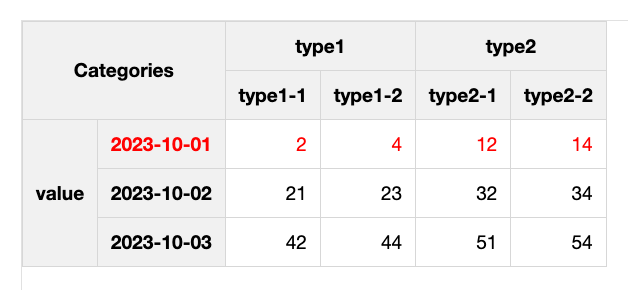
- Whether to include axis settings: Determines whether to include the top axis of the table.
- Not included: The specified value field is displayed at the head of the indicator table.
- Included: Separately displayed by the axis field specified at the top of the indicator table.
E.g.) Exposure indicator table based on the selection of not included/included.
| Not included | 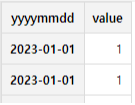 |
| Included | 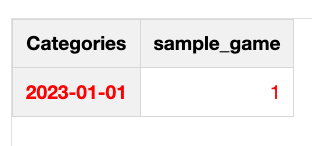 |
-
- Data source information: Select one data source to expose to the indicator.
- Whether to include 0: Whether or not to provide a column containing only zeros when exposing the indicator’s value.
- Whether to include graphs: Whether or not to additionally expose graphs.
- Invert graph X-axis alignment: The graph’s X-axis is in ascending order by default, but you can alter it to descending order.
- Whether to include comments: Whether or not to include comments in the table.
- Ratio color display: If “%” or “(increase/decrease)” is specified in a field of the data source, an increase will be displayed in red and a decrease in blue.
- After adjusting the position of the table to be displayed in the indicator, select Next and then OK to save the page source.
- Axis items: Items listed in Select an axis from a data source.
- Value items: Items listed in Select values from a data source.
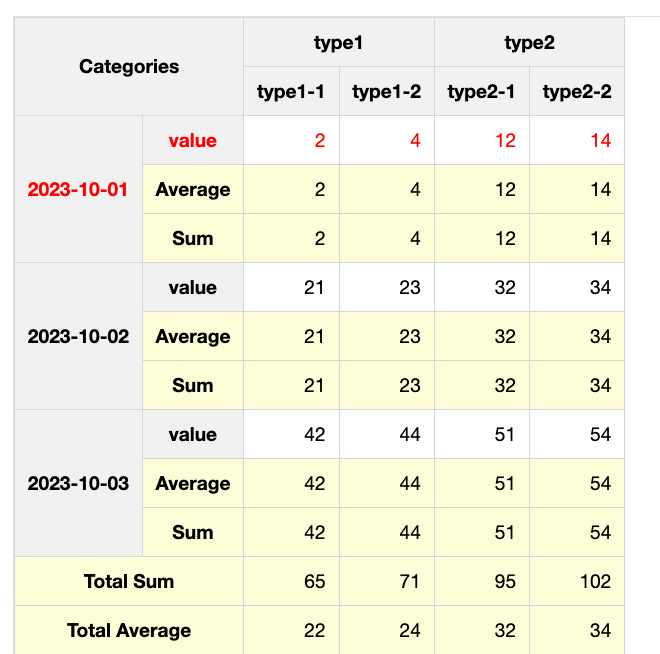
- Total Display: This feature allows the automatic display of the total in the table..
- No Total: There will be no display of totals.
- Vertical Axis Total: Totals are displayed beside the vertical axis, providing the sum for each row.
Picture) Vertical Axis Total Display
-
-
- Horizontal Axis Total: Totals are displayed alongside the vertical axis, showing the sum for each row.
-
Picture) Horizontal Axis Total Display
-
-
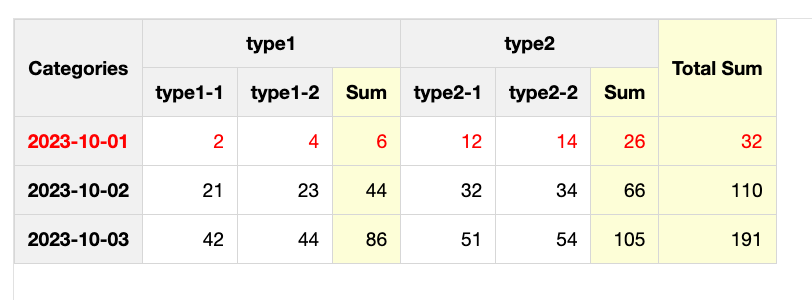
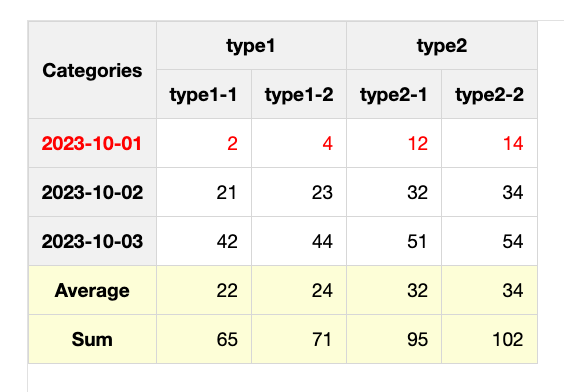
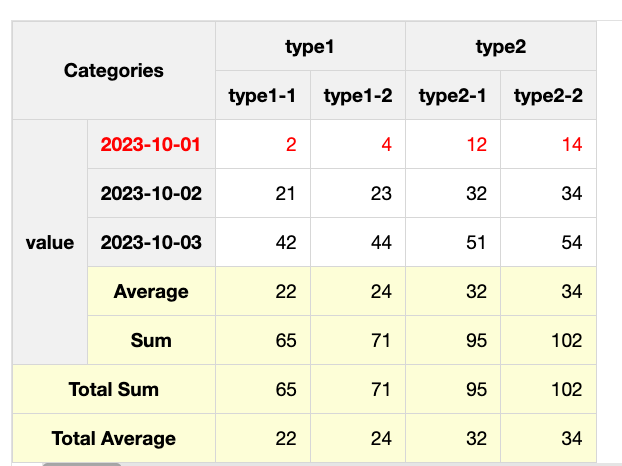
- Horizontal Axis Interim Total: Similar to horizontal axis totals, but you can choose to place the subsequent Σ value “Before Vertical Axis” or “After Vertical Axis,” adding an additional total in the middle.
-
Picture) Horizontal Axis Interim Total & Before Vertical Axis
Picture) Horizontal Axis Interim Total & After Vertical Axis
-
-
- All Total Display: Totals for both rows and columns are provided.
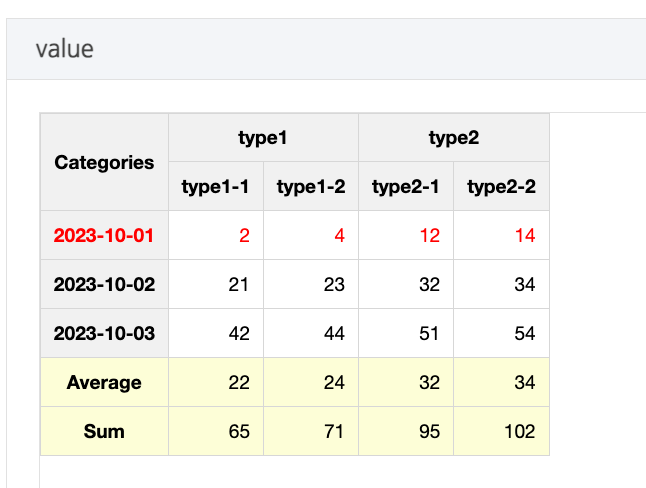
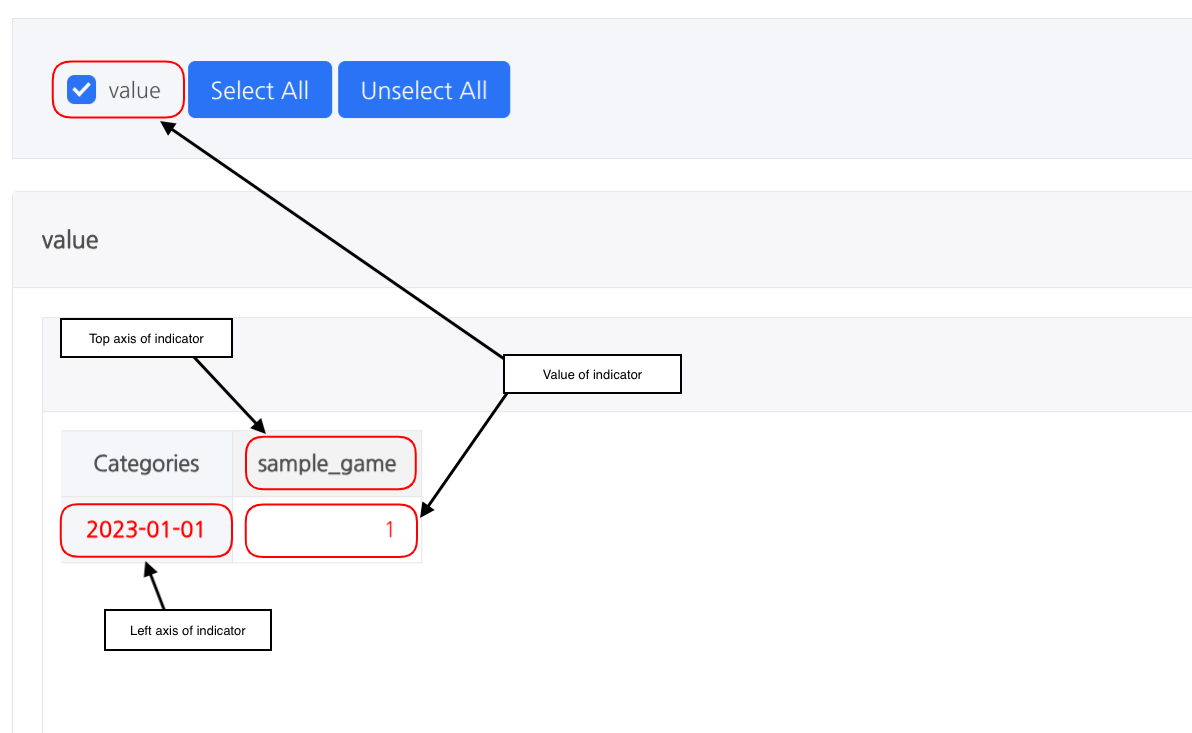
- Σ Value Position (for multiple items): Specifies where values are displayed in the table.
- Select one by one: The values placed in the “Value of Indicators” area are separately displayed in the table one by one and are exposed in the “Select value” area at the top of the indicators page.
-
Photo) Set to “Select one by one” so that values can be selected on the indicator page.
-
-
- Before Vertical Axis: Values are displayed on the right side of the left axis area in the table.
-
Photo) Display the value as “Before Vertical Axis”
-
-
- After Vertical Axis: Values are displayed on the left side of the left axis area in the table.
-
Photo) Display the value as “After Vertical Axis”
-
-
- Above Horizontal Axis: Values are displayed above the top axis area in the table.
-
Photo) Display the value as “Above Horizontal Axis”
-
-
- Below Horizontal Axis: Values are displayed below the top axis area in the table.
-
Photo) Display the value as “Below Horizontal Axis”
-
- Placement: The items that will form the table’s rows can be dragged and placed on the left, while the items that will form the table’s columns can be dragged to the top. The values to be exposed are set in the center of the value items.
Photo) Axis/value placement in page source
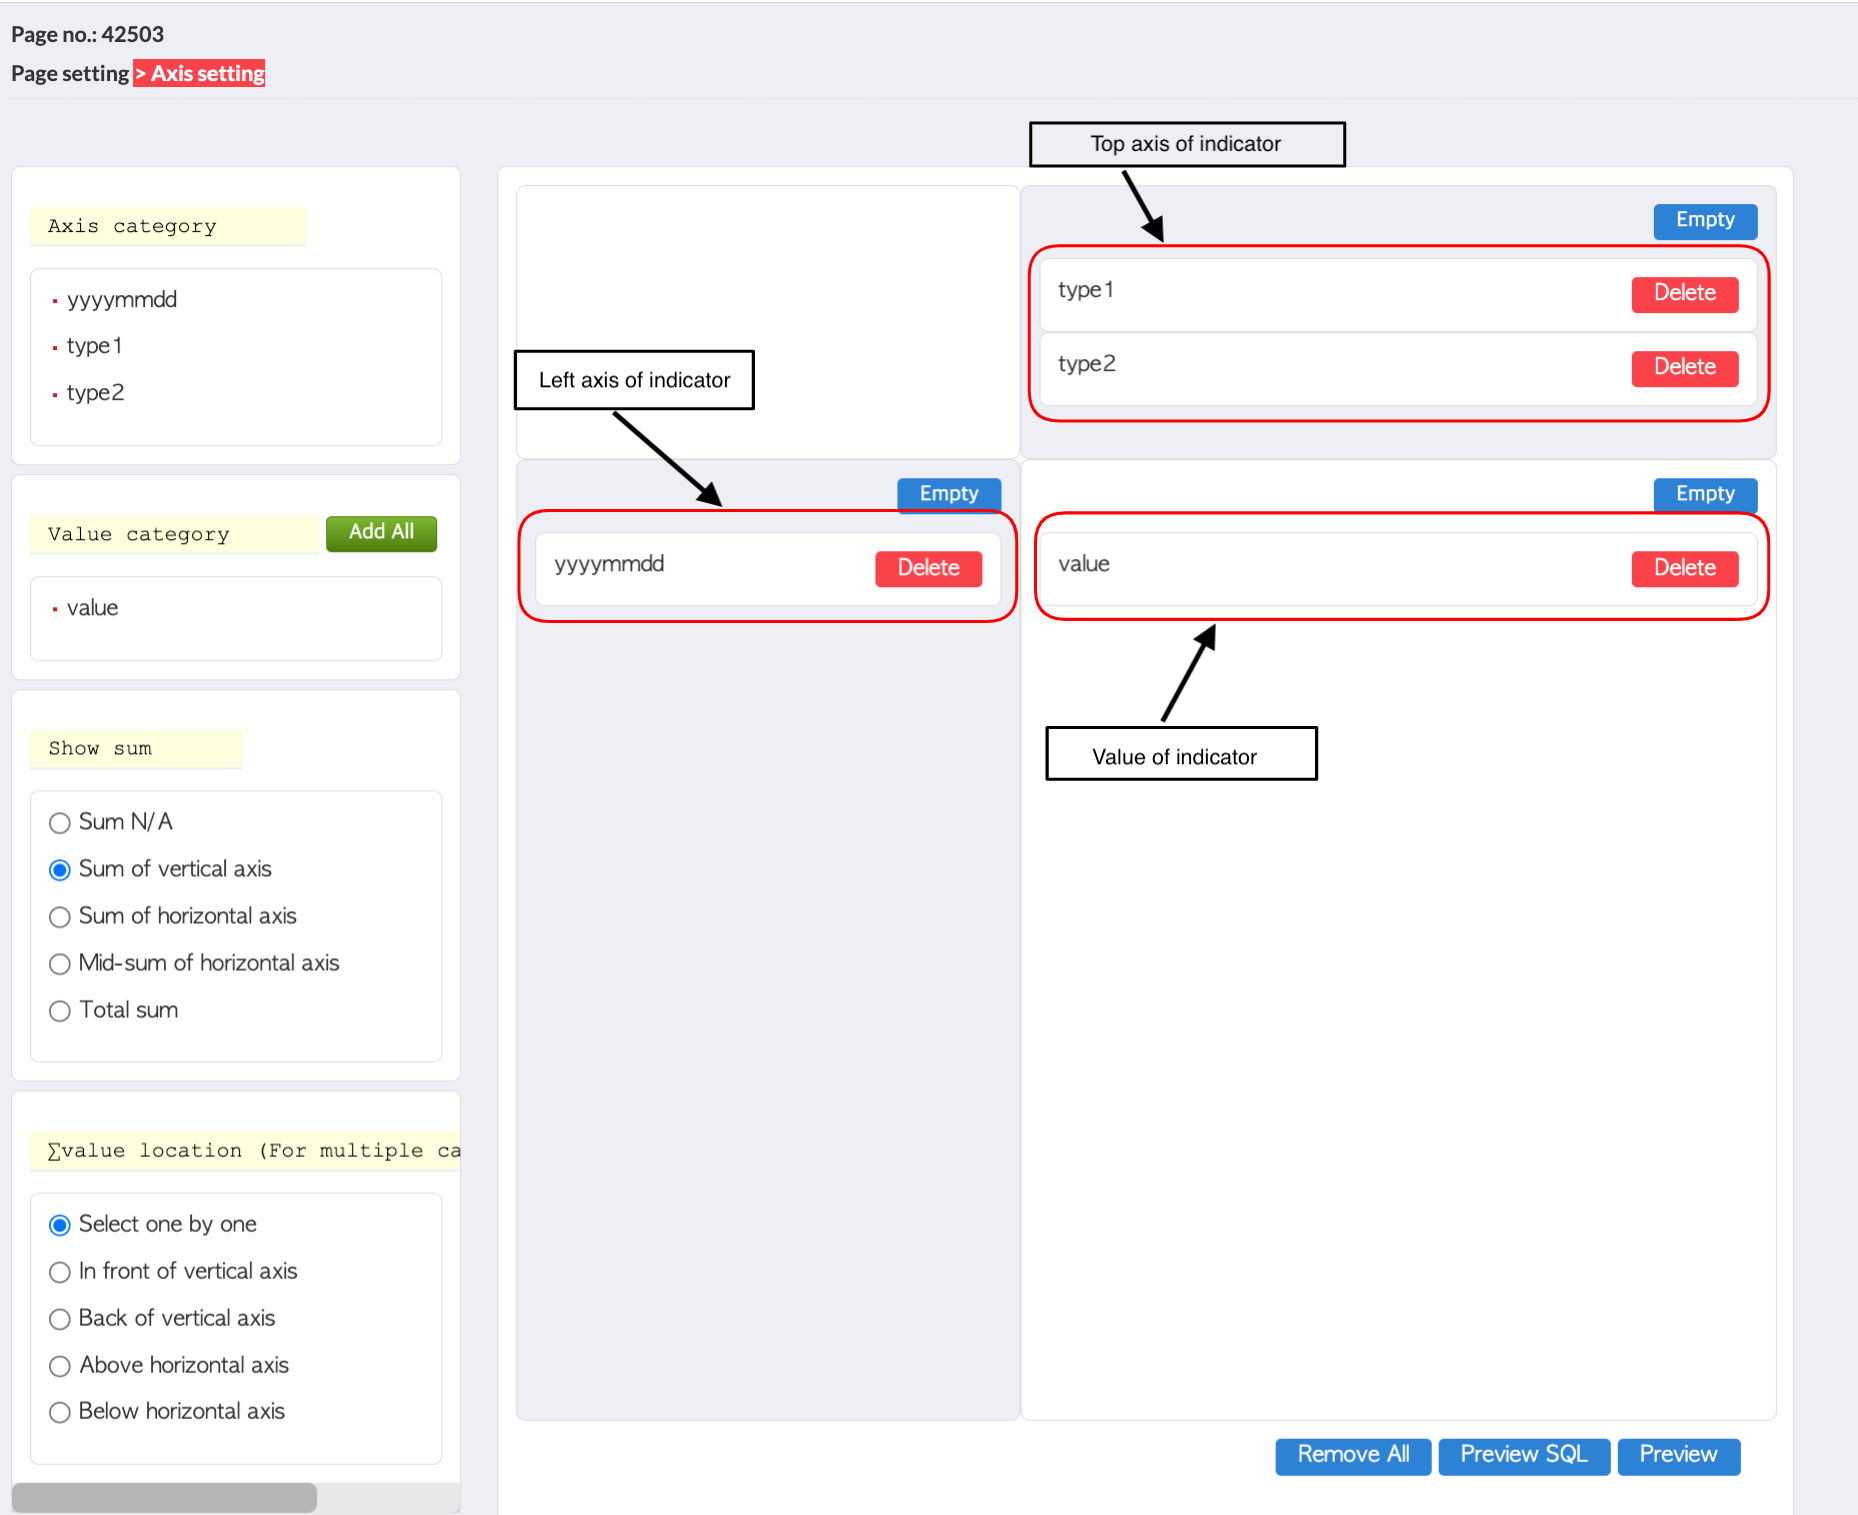
Photo) Configuration of the indicator page based on the axis/value configuration of the page source
-
- Delete all: You can simultaneously delete the placed axis and values.
- SQL preview: You can view Big Query SQL from the data source.
- Preview: You can preview the screen displayed on the indicator.
- Select “Use” for the “Used/Not used” option of the newly inserted page source in the list of page sources.
- Select the location or game that will be inserted as a custom indicator for the “Custom indicator application location” item of the page source list.
- Specific game indicators for each game: The game-specific indicators are accessible in the location game-specific indicators > custom indicators regardless of the selected game.
- Comprehensive indicator: Appears where custom indicator > comprehensive indicator.
- Name of the game: The indicator for each game is only displayed at the game indicator > custom indicator location specified.
- To alter the tab menu order of comprehensive indicator/game-specific indicator > custom indicator, adjust the number in the “Custom indicator order” option. The placement order is numerically ascending.
Check the results of the indicator configuration
- Once the page source definition has been finalized, the registration of the custom indicator in Analytics is complete. It is accessible via the “Console > Analytics > Game-specific indicator > Custom indicator” menu, and the tab exposure order is determined by the “Tab Sort Order” configuration within the page source settings.
- If there is a large amount of data exposed to the indicator, the actual data is delivered as a CSV format.
Attempt to configure a custom indicator
Case 1. Configuration of the daily DAU indicator
Daily DAU can be configured as an indicator using the hive_login_log log, which is automatically collected upon authenticating into the game, eliminating the need to define and transmit logs. The sample log simulates the log definition function using ETL.
ETL simulation of sending and examining sample logs in hive_login_log
- Navigate to “Console > Analytics > Log Definition”
- Select hive_login_log as the log name for the search function, then select the search button.
- When hive_login_log is displayed, click to review the schema information and then proceed to the ETL simulation section at the bottom.
- After entering and confirming each field’s value, select “Send Sample Data.”
- Examine the sample log sent via data preview.
Utilize BigQuery to build daily DAU queries
- Access Big Query after obtaining permission to do so in advance.
- Execute the query that will be used on the data source directly in BigQuery using the daily DAU lookup query for the previous seven days based on UTC.
SELECT DATE(datetime) as yyyymmdd, appidGroup, count(distinct playerid) as dau
FROM fluted-airline-109810.analytics_Number_live.t_hive_login_log
WHERE datetime >= TIMESTAMP_TRUNC(timestamp_add(current_timestamp(), interval -7 day), DAY) and dateTime < timestamp_trunc(current_timestamp(), day) and appidGroup in ('appidGroup')
group by yyyymmdd, appidGroup
order by yyyymmdd, appidGroup
Define data source
- Access the “Console > Analytics > Management > Data Source” menu.
- Click the “Register Data Source” button.
- Enter the required information below and then select Next.
- Data source name: “Case 1 Daily DAU Data Source”
- Date classification: Select daily
- Database: Select BIGQUERY
- SQL Query
SELECT DATE(datetime) as yyyymmdd, appidGroup, count(distinct playerid) as dau
FROM ##companyDataset##.t_hive_login_log
where datetime >= TIMESTAMP('##FROMDT##') and datetime < timestamp_add(TIMESTAMP('##TODT##'), interval 1 day) and appidGroup in ('##appidGroup##')
group by yyyymmdd, appidGroup
order by yyyymmdd, appidGroup
- Click Next after specifying the axis and value selections.
- Select axis: select appidGroup, yyyymmdd
- Select value: select dau
- To save the data source, select Sort appidGroup, yyyymmdd in ascending order, click Next, and then click OK.
Define page source
- Access the “Console > Analytics > Management > Page Source” menu.
- Click the “Register Page Source” button.
- Enter the information below for indicator configuration and click Next.
- Page Title: “Case 1 Daily DAU Page Source”
- Axis settings included or not: Included
- Data Source Information: Select “Case 1 Daily DAU Data Source”
- 0 Included: Included
- Graph included: Included
- Invert graph X-axis alignment: Not included
- Display ratio color: not selected
- Set the axis and value placement as shown below.
- Placement left: yyyymmdd
- Place top: appid
- Value: dau
- Click the Preview button to check whether the table and graph are displayed properly.
- Click OK to save the page source.
- In the page source list, select “Enabled/Not used” in the “Case 1 Daily DAU Page Source” list.
- In the page source list, select “Apply custom indicator location” in the “Case 1 DAU page source by day” list to “Indicator by game for all games.”
- In the page source list, specify “Custom indicator order” in the “Case 1 daily DAU page source” list as 1.
Check the indicator configuration results
- Access the “Console > Analytics > Game-specific indicator > Custom indicator” menu.
- Verify that a tab named “Case 1 Daily DAU Page Source” is visible.
- Click “Case 1 Daily DAU Page Source” to check whether the tables and graphs are displayed properly.
- If there is a large amount of data exposed to the indicator, the actual data is delivered as a CSV format.
Case 2. Send stage clear log and configure indicator
Follow the steps below to transmit the game’s stage log and configure the indicator. The sample log uses an ETL simulation of the log definition function.
Define stage clear log
- Access the “Console > Analytics > Log Definition” menu.
- After selecting the game, click the “Define Log” button.
- Enter “sample_stage_clear” in the table name.
- Enter “sample log” in the description.
- In the Definition field settings, enter the information below.
- Field name: stage_clear
- Select type: string
- Description: Whether the stage is cleared or not
- Sample value: success
- Go to the bottom and click Register.
Sending and checking sample logs to sample_stage_clear with ETL simulation
- Access the “Console > Analytics > Log Definition” menu.
- Select the log name for the search function, enter sample_stage_clear, and click the search button.
- When sample_stage_clear is exposed, click to check the defined schema information and move to the ETL simulation at the bottom.
- Enter values in each field and click Submit.
- Check the sample log sent through data preview.
Access Big Query and create daily stage clear queries
- Access Big Query after obtaining Big Query access permission in advance.
- Run the query to be used on the data source directly in BigQuery using the daily stage clear query based on UTC below.
SELECT DATE(datetime) as yyyymmdd, stage_clear, appidGroup, count(distinct playerid) as cnt
FROM fluted-airline-109810.analytics_Number_live.t_sample_stage_clear
WHERE datetime >= TIMESTAMP_TRUNC(timestamp_add(current_timestamp(), interval -7 day), DAY) and dateTime < timestamp_trunc(current_timestamp(), day) and appidGroup in ('appidGroup')
group by yyyymmdd, stage_clear
order by yyyymmdd, stage_clear
Defining data sources
- Access the “Console > Analytics > Management > Data Source” menu.
- Click the “Register Data Source” button.
- Enter the information below in the required fields and click Next.
- Data source name: “Case 2 stage clear data source”
- Date classification: Select daily
- Database: Select BIGQUERY
- SQL Query
SELECT DATE(datetime) as yyyymmdd, stage_clear, count(distinct playerid) as dau
FROM ##companyDataset##.t_sample_stage_clear
where datetime >= TIMESTAMP('##FROMDT##') and datetime < timestamp_add(TIMESTAMP('##TODT##'), interval 1 day) and appidGroup in ('##appidGroup##')
group by yyyymmdd, stage_clear
order by yyyymmdd, stage_clear
- After specifying the axis selection and value selection, click Next.
- Select axis: stage_clear, select yyyymmdd
- Select value: select cnt
- Select stage_clear, Sort yyyymmdd in ascending order, click Next, and then click OK to save the data source.
Define page source
- Access the “Console > Analytics > Management > Page Source” menu.
- Click the “Register Page Source” button.
- Enter the information below for indicator configuration and click Next.
- Page title: “Case 2 stage clear page source”
- Whether to include axis settings: Included
- Data source information: Select “Case 2 stage clear data source”
- Whether to include 0: Included
- Whether to include graph: Included
- Invert graph X-axis alignment: Not included
- Display ratio color: Not selected
- Place the axis and values as shown below.
- Placement left: yyyymmdd
- Placement top: stage_clear
- Value: cnt
- To determine whether the table and graph are displayed appropriately, click the Preview button.
- Click OK to save the page source.
- In the page source list, select “Enable/Disable” in the “Case 2 stage clear page source” list to Enable.
- In the page source list, select “Custom indicator application location” under “Case 2 stage clear page source” as “indicator game for each game.”
- Set “Custom indicator order” in the “Case 2 stage clear page source” list to 1 in the page source list.
Check the indicator configuration results
- Proceed to “Console > Analytics > Game-specific indicator > Custom indicator”
- Determine if the tab titled “Case 2 stage clear page source” is visible.
- To ensure that the tables and graphs are displayed appropriately, click “Case 2 stage clear page source”
- If there is a large amount of data exposed to the indicator, the actual data is delivered as a CSV format.