Ad View Conversion Rate
- Ad view conversion rate refers to the conversion rate at each stage, ad load – start of viewing – reward completion. Generally, a conversion rate closer to 100% indicates well-designed ads.
- You can collect three ad viewing event timings through Hive Adkit.
- Ad Load (load): When the ad is requested, or the request is completed.
- Start of Viewing (open): When the ad is displayed on the device.
- Reward Completion (reward): When a user completes viewing a rewarded ad and receives the reward.
-
Open Rate
- The open rate measures the percentage of ads requested by rewarded and interstitial ads converted to be displayed. It helps determine if ads are effectively delivered to users.
- Open Rate = (Started View Count / Ad Load Count) *100
- If indicators have decreased in a specific segment, you can check if ads are designed as intended.
- The ad load count might increase if ads are pre-requested when the app is launched.
- If there is a limit on the number of ad views, users might not be able to start viewing ads.
- The open rate measures the percentage of ads requested by rewarded and interstitial ads converted to be displayed. It helps determine if ads are effectively delivered to users.
-
Reward Rate
- The reward rate is the percentage of users who watched the entire ad among those who started watching the ad in rewarded ads. It helps assess user engagement with ad components.
- Reward Rate = (Completed Reward Count / Started View Count) *100
- If the target value is not achieved in a specific segment, it could be due to longer ad viewing time or inappropriate content, causing user drop-offs during ad viewing.
- The reward rate is the percentage of users who watched the entire ad among those who started watching the ad in rewarded ads. It helps assess user engagement with ad components.
Calculate Ad View Conversion Rate in BigQuery
- Use BigQuery to analyze the indicators of ad viewing funnels, identifying where users might be dropping off. You can visualize the indicators by linking query results with spreadsheets.
- During the initial implementation of the ad module, you can observe the trend of indicators and set target values for each segment.
- By examining the recent trend of indicators, you can determine if the intended targets are being achieved appropriately.
- If you introduce new ad placements or adjust reward item quantities in your ad planning, you can compare the indicators before and after the changes.
-
Enter BigQuery Query
-
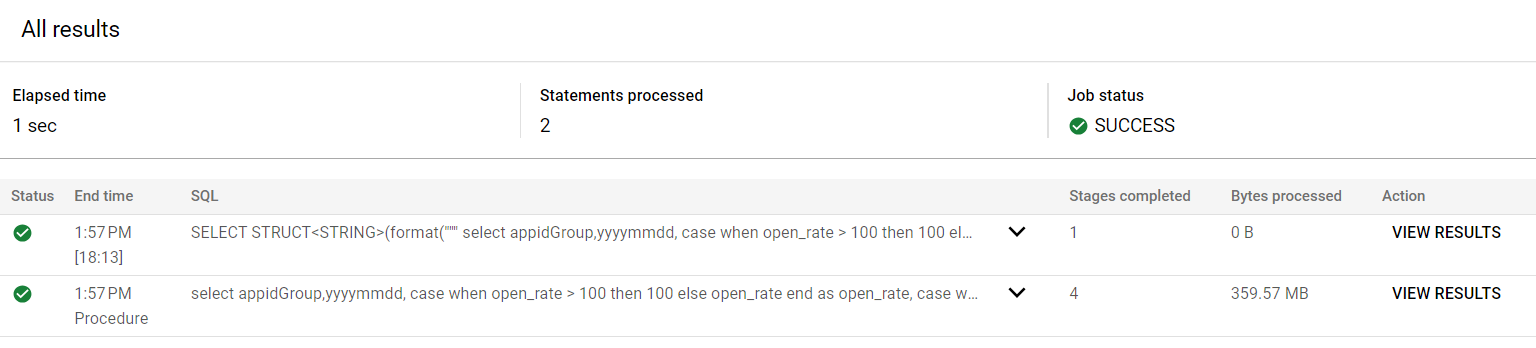
- Copy and paste the sample query below into the query editor. Manually enter the five parameters corresponding to the set, and then click the “Run” button at the top (or press Ctrl + Enter).
- yyyymmdd_1 : Start date of the query
- yyyymmdd_2 : Last date of the query
- timezone_offset : Set the time zone (9 for KST)
- appidGroup_1 : App Center Game Id
- For multiple inputs,
set appidGroup_1 = ' "game1","game2" ';
- For multiple inputs,
- company_index : Company number
- You can find this in BigQuery > Explorer in the upper left > dataset (analytics_company number_live) under fluted-airline-109810
- Sample Query
declare yyyymmdd_1 string ;

declare yyyymmdd_2 string ;

declare timezone_offset int64;

declare appidGroup_1 string;

declare company_index int64;

declare dataset string default '';

declare query string default '';
set yyyymmdd_1 = '2023-07-01';

set yyyymmdd_2 = '2023-07-07';

set timezone_offset = 9 ;

set company_index = 5 ;

set appidGroup_1 = '"com.sample.samplegametest"' ;

set dataset = 'analytics_' || company_index || '_live';
set query = format("""
select appidGroup,yyyymmdd,
case when open_rate > 100 then 100 else open_rate end as open_rate,
case when reward_rate > 100 then 100 else reward_rate end as reward_rate,
load_cnt,
case when open_cnt > load_cnt then load_cnt else open_cnt end as open_cnt,
case when reward_cnt > open_cnt then open_cnt else reward_cnt end as reward_cnt
from
(
select appidGroup,yyyymmdd,
ifnull(round(((safe_divide(count(ad_open), count(ad_load))) * 100),2),0) as open_rate,
ifnull(round(((safe_divide(count(ad_reward), count(ad_open))) * 100),2),0) as reward_rate,
count(ad_load) as load_cnt,
count(ad_open) as open_cnt,
count(ad_reward) as reward_cnt
from
(
select appidGroup,yyyymmdd,
case when eventType ='load' then checksum end as ad_load,
case when eventType='open' then checksum end as ad_open,
case when eventType='reward' then checksum end as ad_reward
from
(
select appidGroup, checksum, eventType,
substr(cast(timestamp_add(dateTime, interval %d hour) as string), 1,10) as yyyymmdd
fromfluted-airline-109810.%s.t_hive_ad_watch_log
where (datetime) >= timestamp_sub(timestamp('%s'), interval %d hour)
and (datetime) < timestamp_add(timestamp_sub(timestamp('%s'), interval %d hour), interval 1 day)
and appidGroup in (%s)
and eventType in ('load','open','reward')
qualify row_number() over(PARTITION BY checksum ORDER BY bigqueryRegistTimestamp) =1 )
)
group by appidGroup,yyyymmdd
)
order by appidGroup,yyyymmdd
""",
timezone_offset, dataset, yyyymmdd_1, timezone_offset, yyyymmdd_2, timezone_offset,appidGroup_1);
EXECUTE IMMEDIATE query;
-
-
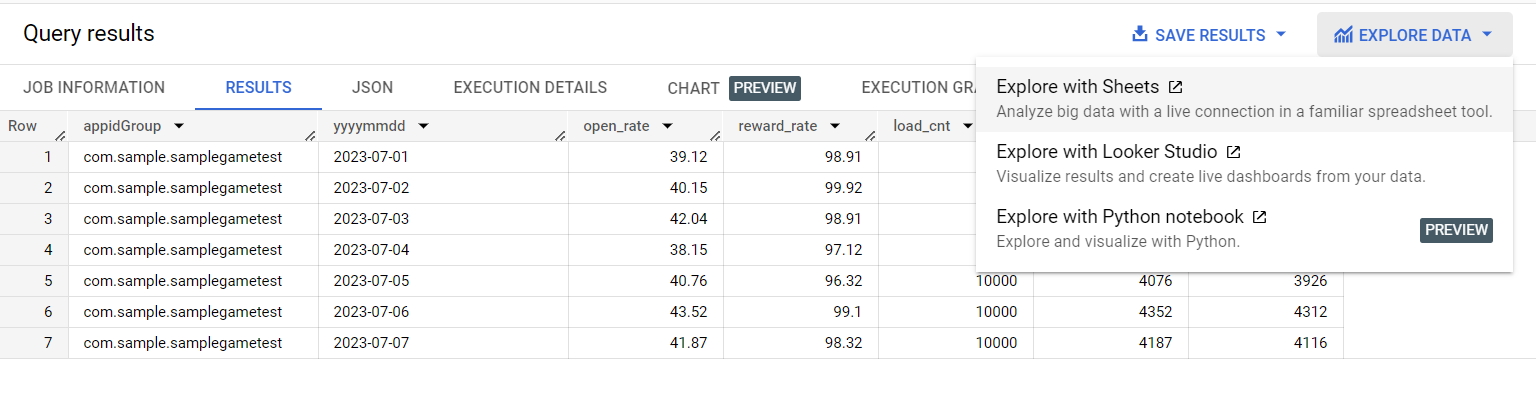
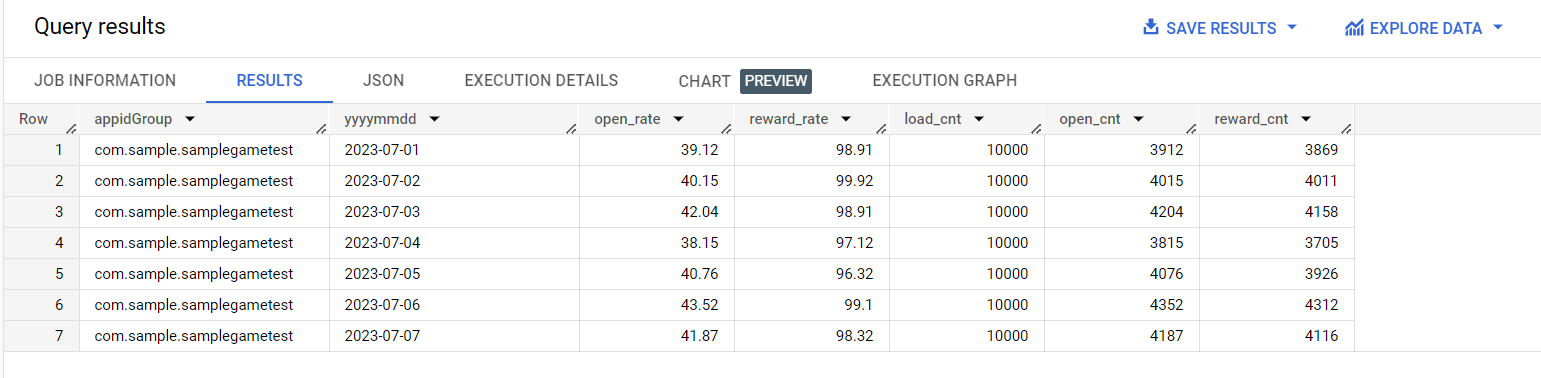
Check BigQuery Query Results
- Click on the “View Results” option at the bottom of the query results window to review the query results.
- appidGroup : App Center Game Id
- yyyymmdd: Date of inquiry
- open_rate : Open Rate
- reward_rate : Reward Rate
- load_cnt : Ad Load Count
- open_cnt : Started View Count
- reward_cnt : Completed Reward Count
- Click on the “View Results” option at the bottom of the query results window to review the query results.
-
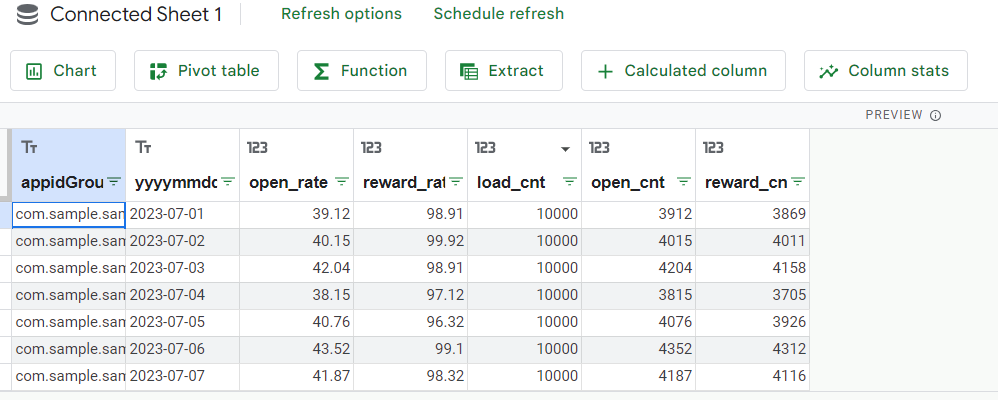
Link with Spreadsheets
- In the Explore Data menu at the top right of the query results window, click Explore with Spreadsheet.
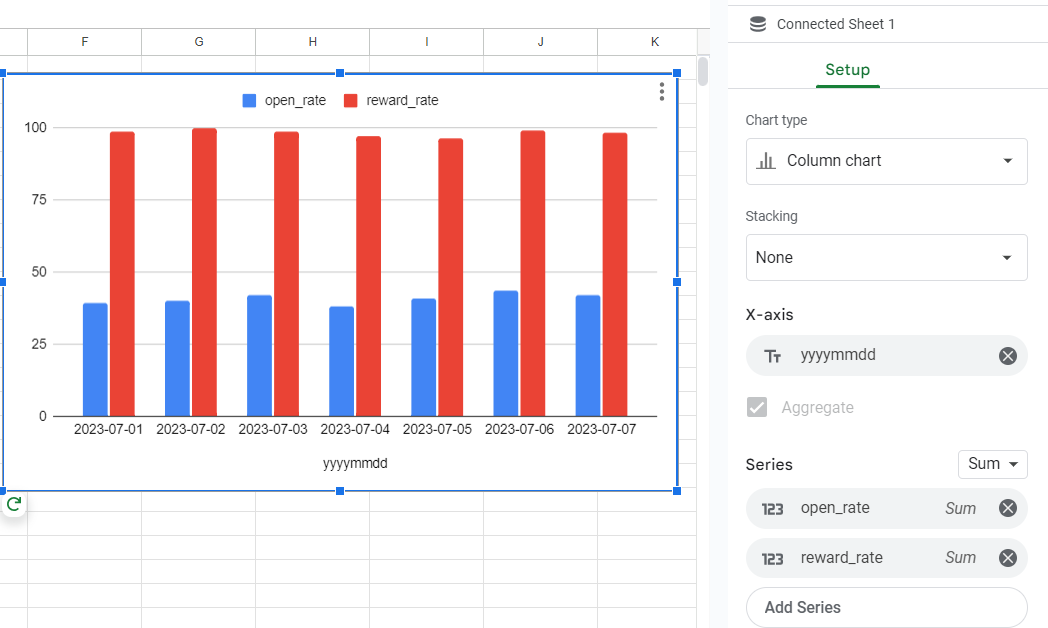
- You can visualize indicators through the chart function.