Cohort analysis is a function to compare and analyze indexes between user groups segmented with a specific condition.
- You must create a segment to use the Cohort Analysis. Click here to find out more about the segment.
- You can select MAX 4 segments or snapshots to check the differences between user group indexes.
- Route: Analytics > Cohort Analysis
Cohort Analysis Screen Guide

Price Option Settings
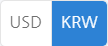
- USD : Displays figures related to revenue in US dollars
- KRW : Displays figures related to revenue in Korean Won.
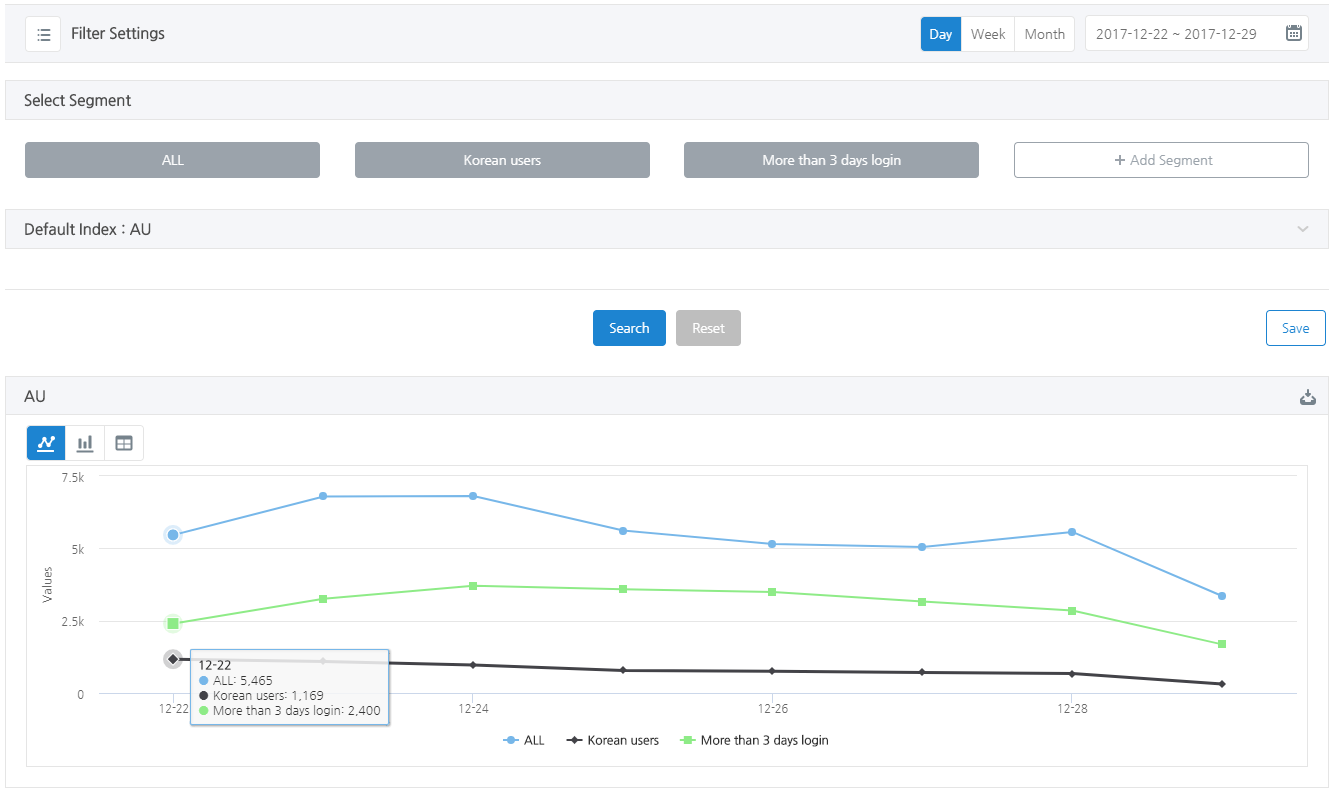
Filter Settings
You can select segments, indexes to check and dates in the Filter Settings.
- Date Selection: You can set the date to search an index for.
- Day: Searches for graphs on a day-to-day basis. You can select up to 90 days.
- Week: Searches for graphs on a weekly basis. You can select up to 12 weeks. 1 week refers to the duration from Sunday to Saturday. If the starting date is not Sunday, from the day you selected until Saturday will be considered as the first week. In the same way, if the end date is not Saturday, from Sunday to the day you selected will be the last week of the selected week.
- Month: Searches for graphs on a monthly basis. You can choose the period without any limit.
- Segment Selection
- You can select up to 4 segments or snapshots among those that you generated in the Hive Analytics V2 Segment/Segment Combination Menu.
- If you select segments only, indexes will be generated after extracting segment users when searching. Thus, it may take some time for the index to be searched.
- If you select snapshots as well, indexes will be generated to target users that correspond to the relevant snapshot.
- Index categories you can select
- The categories of indexes you can select are the same as the default index of Hive Analytics v2. Click here to find out more.
How to Select Segments
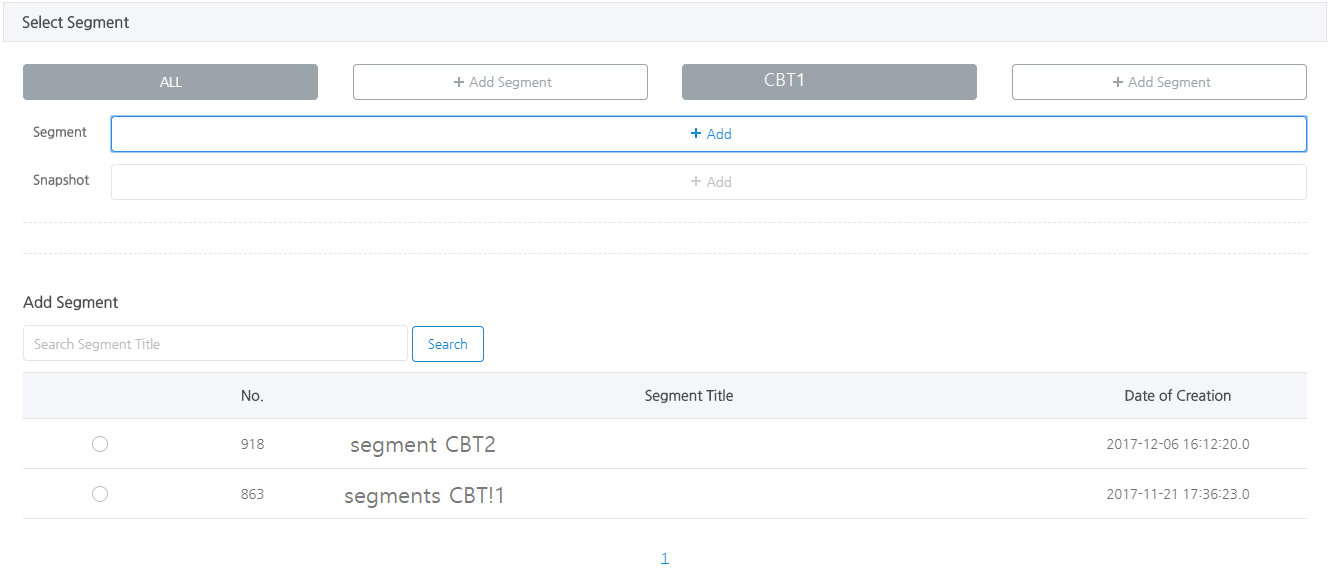
- Click [+ Add Segment] Button to expose a button that you can use to select segments/snapshots at the bottom.
- Click the [+ Add] Button that appeared to expose the segment list of the relevant game and select a segment of your choice with the Radio Button. You can select a snapshot in the same way.
- If you don’t select a snapshot, you can extract users with the corresponding segment condition and generate an index.
- The default value of the segment on the far left targets all users, and you can also select a particular segment/snapshot.
How to Save Filters
You can save filters for indexes that are frequently used to load them quickly instead of setting up conditions every time.
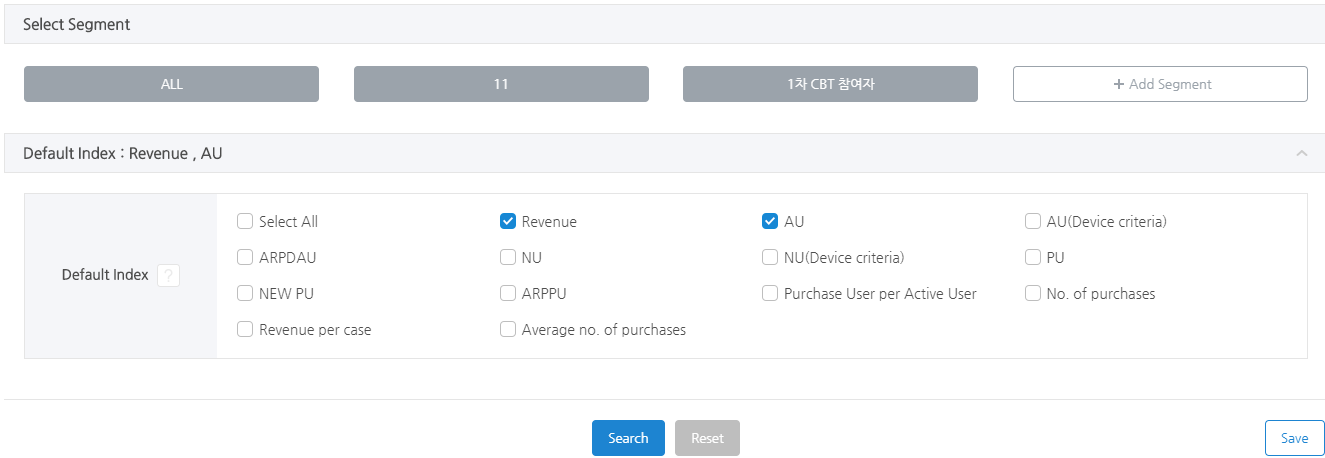
- Select a segment and an index you want to save and click Save. The designated date won’t be saved as a filter.
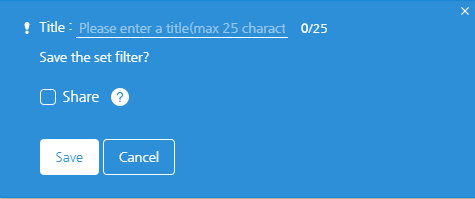
- Below pop-up will appear when you click Save. Enter the filter title, select whether you want to share it or not and click Save.
- If you check “Share”, other users who can view the corresponding game can also use the filter. If you don’t “Share”, only the one who saved the filter can use it.
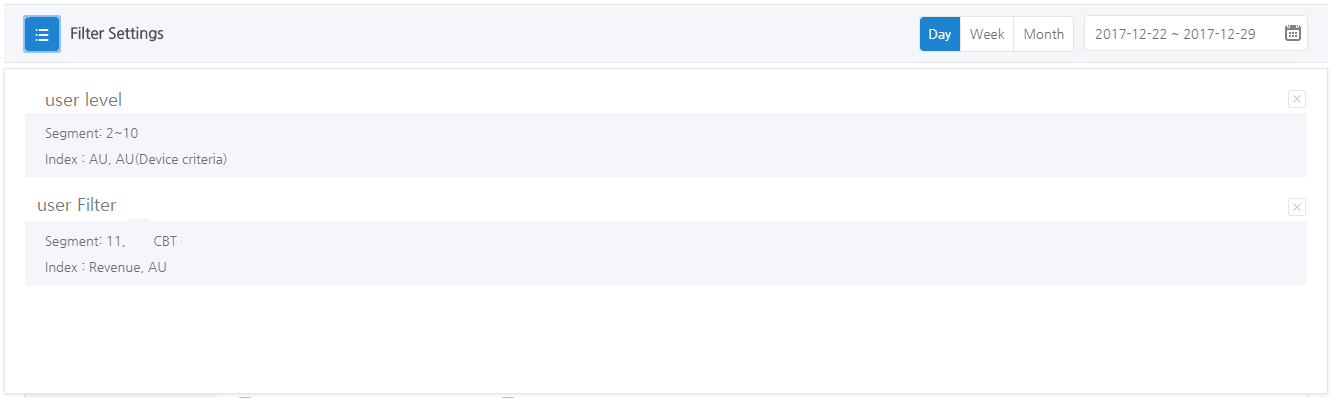
How to Load Saved Filters
- You can select the saved filter from the filter list that appears when you click Button on the left of the Filter Settings.
- Click the title of the filter you saved and it’ll automatically reflect the corresponding filter’s select value.
- You can use [X] Button to delete the filter. Shared filters can only be deleted by the user who created it.
Checking Cohort Analysis Index
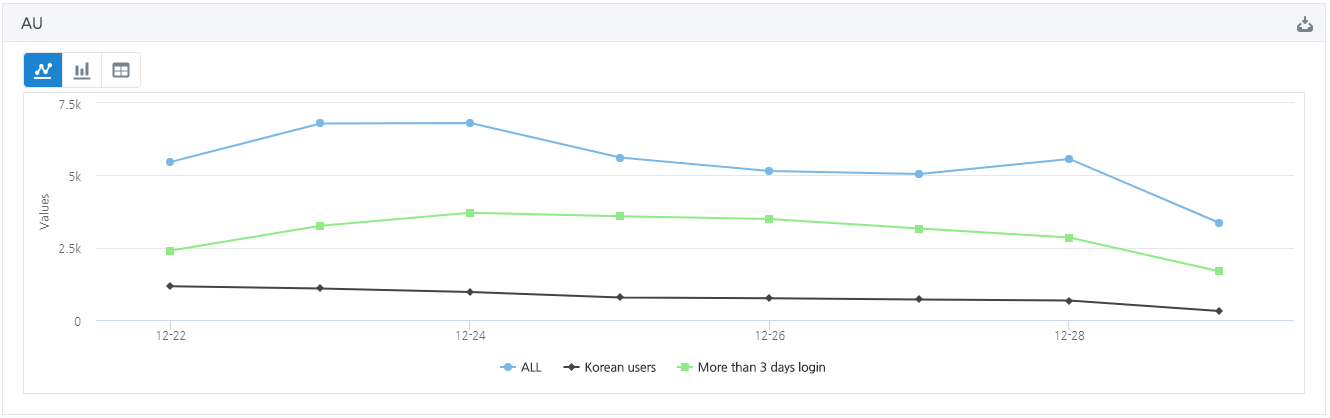
- The default format of an index is a line graph [
 ] and lines are exposed per selected segments.
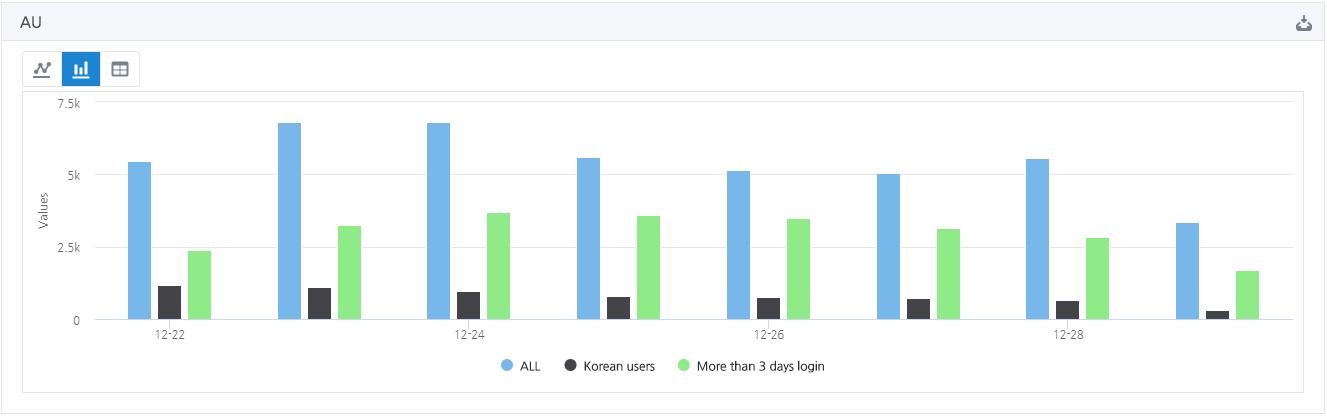
 - You can change the format of the graph into a horizontal bar graph [
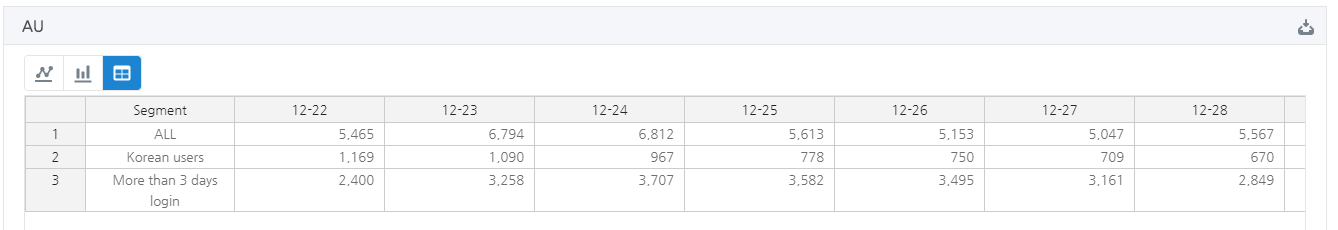
 ] and a chart [
 ].
]. - You can download it as a chart output, PNG, JPEG, PDF, SVG vector, and a CSV file with the Download Button.
Please Note
- Same users may be included in different segments depending on the segment condition. In this case, the number of users will be reflected on each segment value, meaning indexes, such as AU, may have higher value of segments than that of all users.
- You should take filtering period of the cohort analysis and login period of segment users into consideration when setting up. For instance, the index value can be 0 if you select a segment that targets dormant users during the index period.
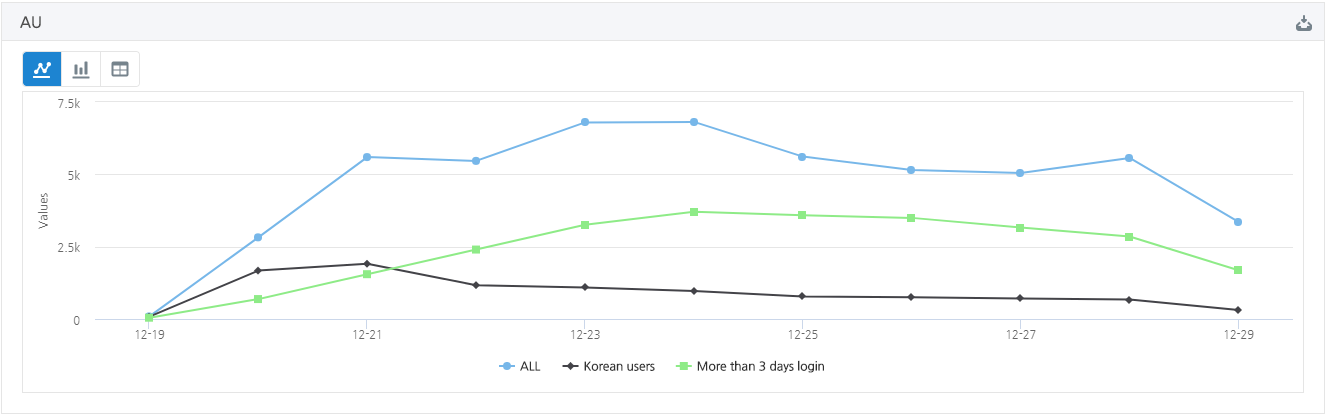
An example of a graph searched with a designated day/week/month
- Set up duration in day(s)
- Values will be displayed on a daily basis.
- You can select up to 90 days.
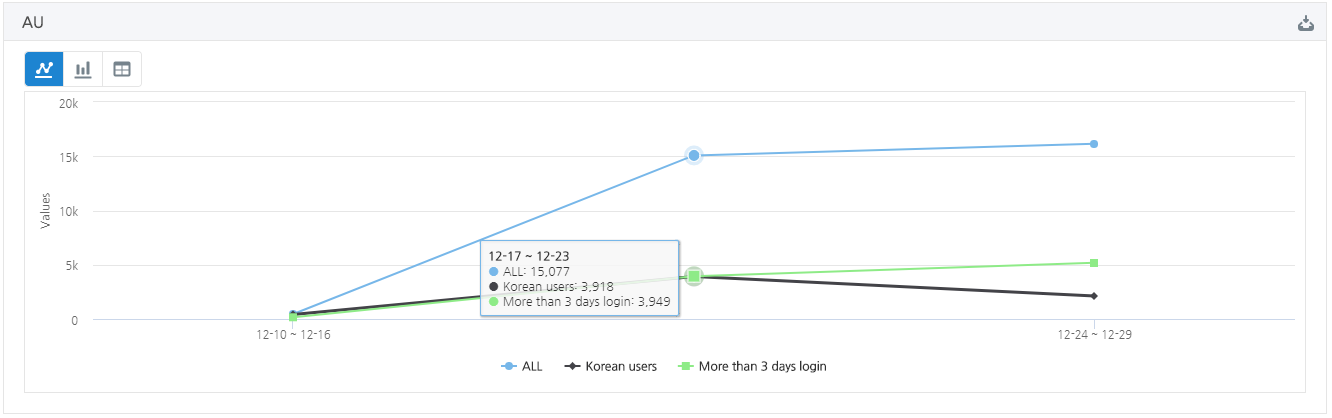
- Set up duration in week(s)
- Values will be displayed based on the sum of each week.
- You can select up to 12 weeks.
- Often, AU will be calculated as WAU and PU will be calculated as WPU if you select duration on a weekly basis. For instance, AU will be displayed as 1 even if it’s a user that logged in multiple times a week.
- Set up duration in month(s).
- Values will be displayed based on the sum of each month.
- You can select without any limit.
- If you select the duration in months, AU will be calculated as MAU and PU will be calculated as MPU. For instance, AU will be displayed as 1 even if it’s a user that logged in multiple times a month.

Example by Graph Type
- Line graph & horizontal bar graph (in order)