Create Custom Indicator for Each Game
- Register sample queries for each indicator in the data source and set up the page source to check indicators for specific games in Analytics.
- You will need authorization for Analytics – Administration, Page Source, and Data Source menus to create customized indicators.
- Please refer to the basic custom indicator guide here.
- For the basic guide on using BigQuery, please check here.
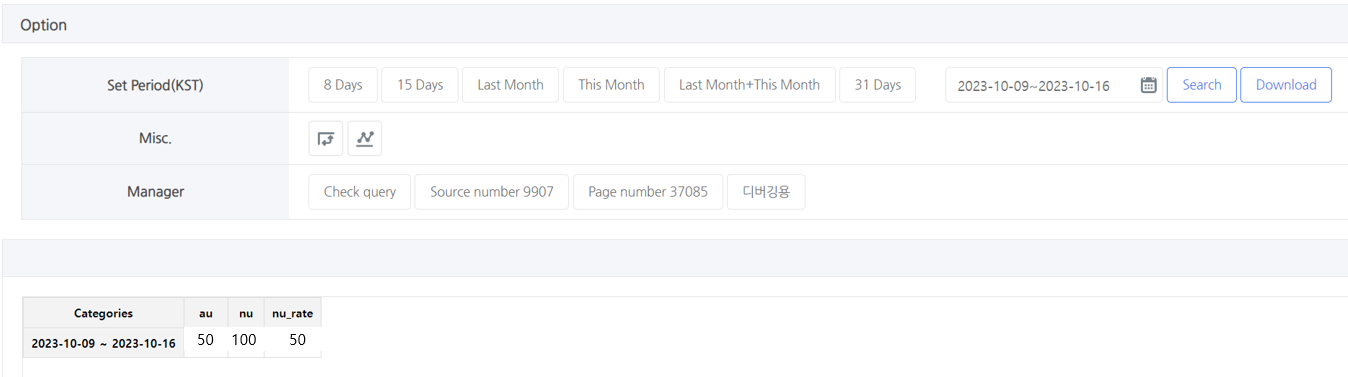
Period AU, NU, NU Rate
- Cumulative AU, NU, and NU to AU rate during the search period.
- The indicator can also be viewed in BigQuery.
- Creating indicators involves two steps: defining a data source and defining a page source.
Step 1: Define Data Source
- Go to the Console > Analytics > Manage Indicator > Data Source, and then click the Register “Data Source” Button.
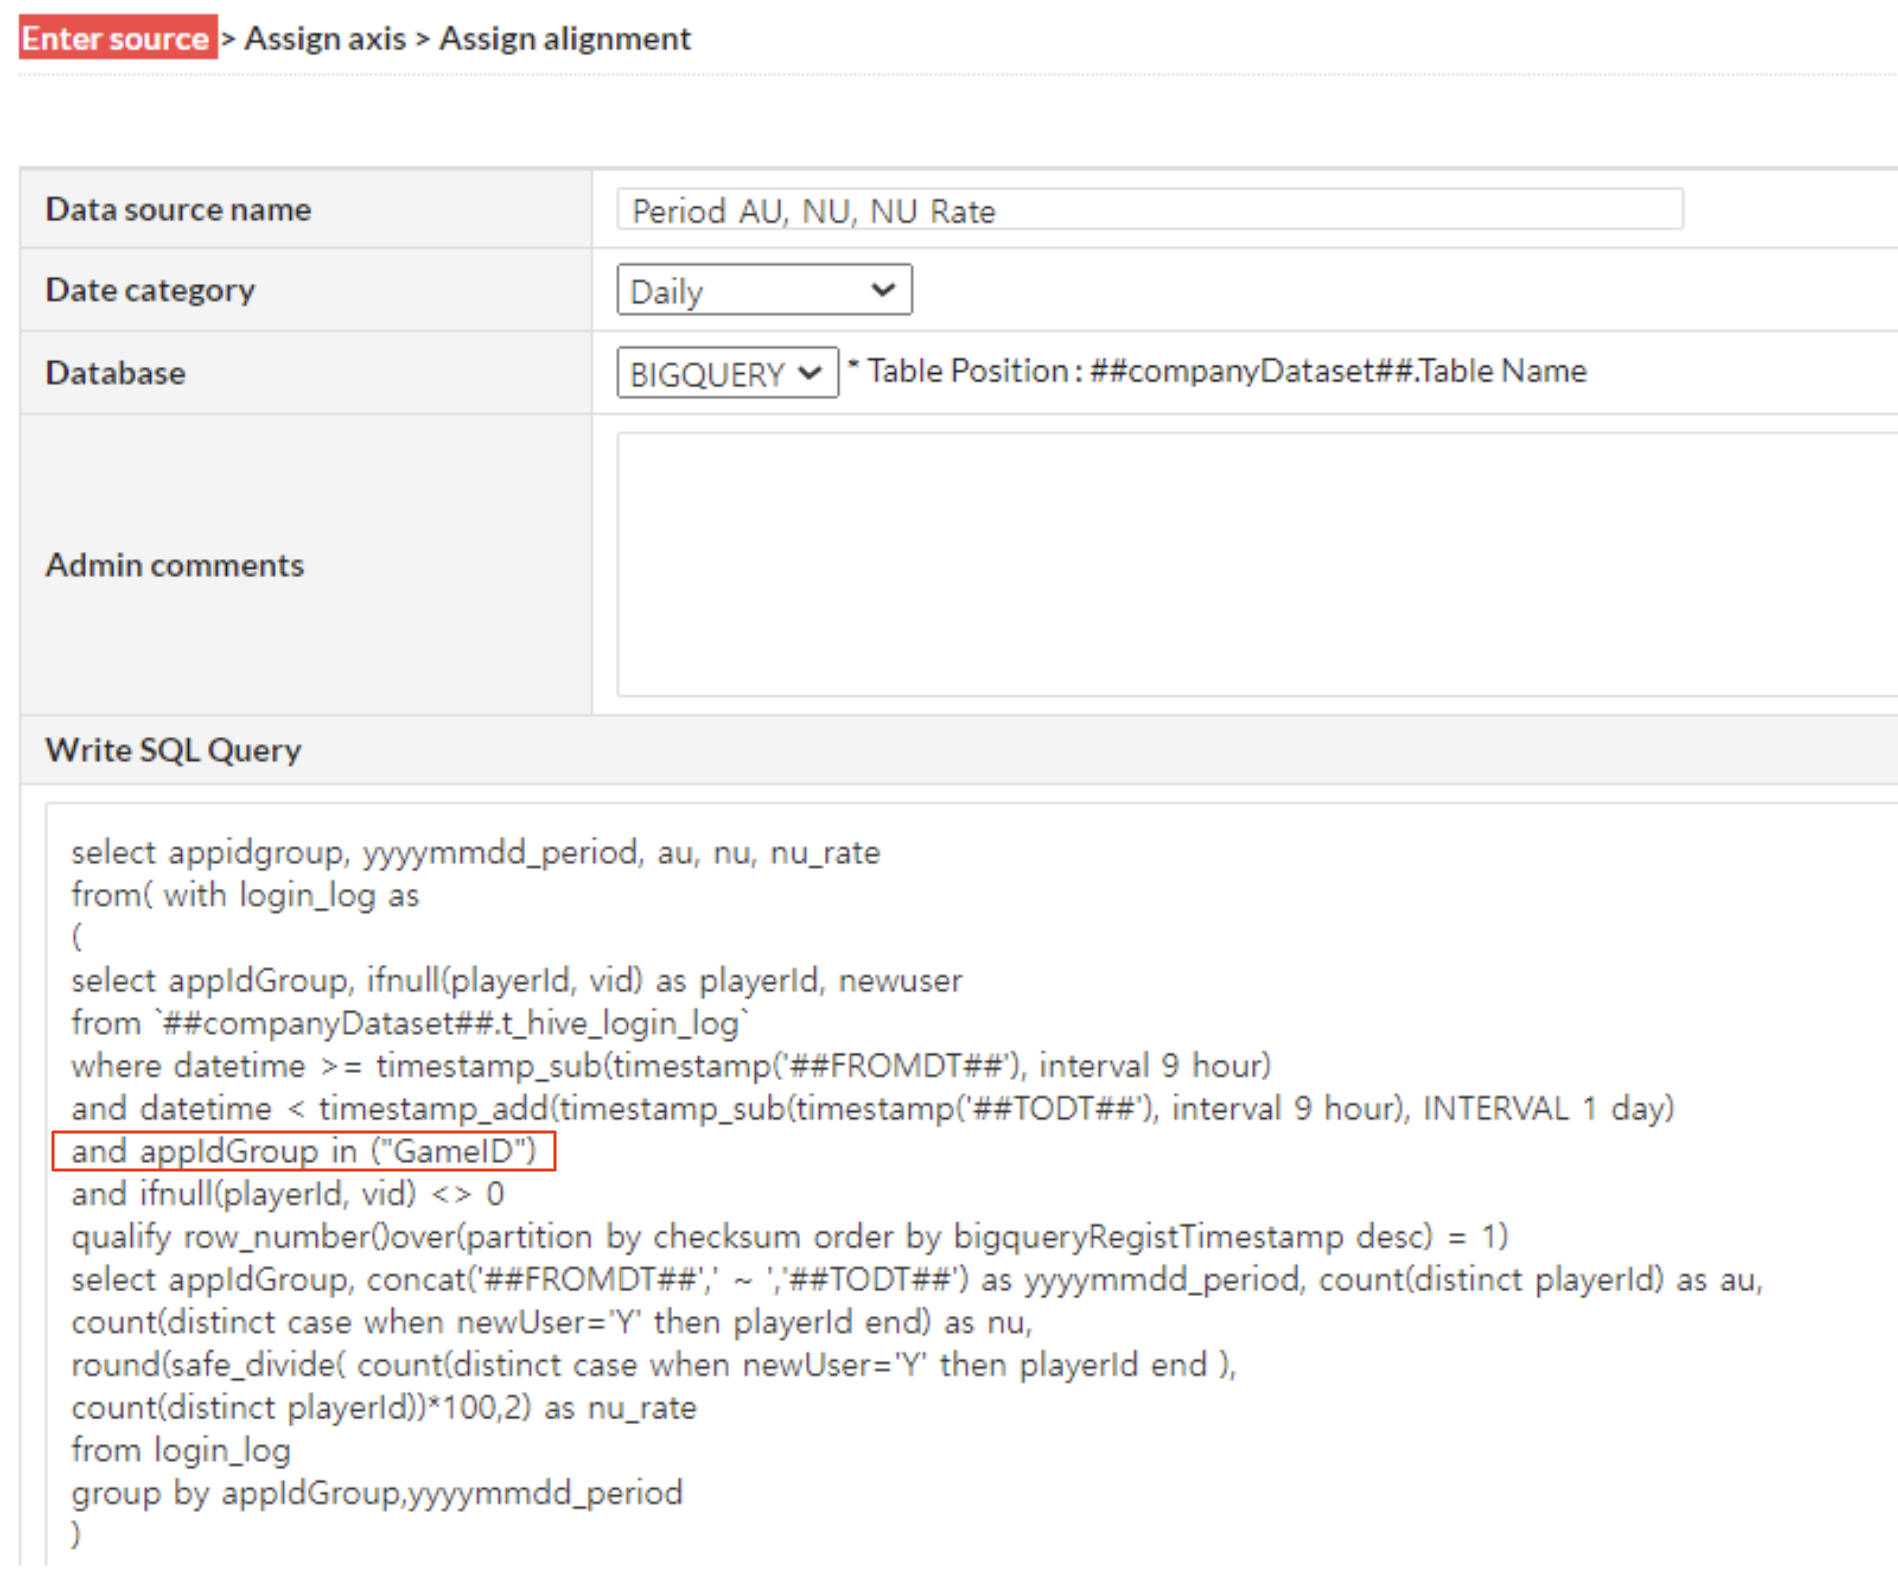
- Select and enter the information below and click Next.
- Select
- Date Range: Daily
- Database: BIGQUERY
- Enter
- Data Source Name: Period AU, NU, NU Rate
- Write SQL Query
- Paste the sample query below and modify GameID.
- GameID: The GameID of the game to which the indicator applies in App Center
- Paste the sample query below and modify GameID.
- Select
select appidgroup, yyyymmdd_period, au, nu, nu_ratewhere datetime >= timestamp_sub(timestamp('##FROMDT##'), interval 9 hour) and datetime < timestamp_add(timestamp_sub(timestamp('##TODT##'), interval 9 hour), INTERVAL 1 day) and appIdGroup in ("GameID") and ifnull(playerId, vid) <> 0 qualify row_number()over(partition by checksum order by bigqueryRegistTimestamp desc) = 1) select appIdGroup, concat('##FROMDT##',' ~ ','##TODT##') as yyyymmdd_period, count(distinct playerId) as au, |
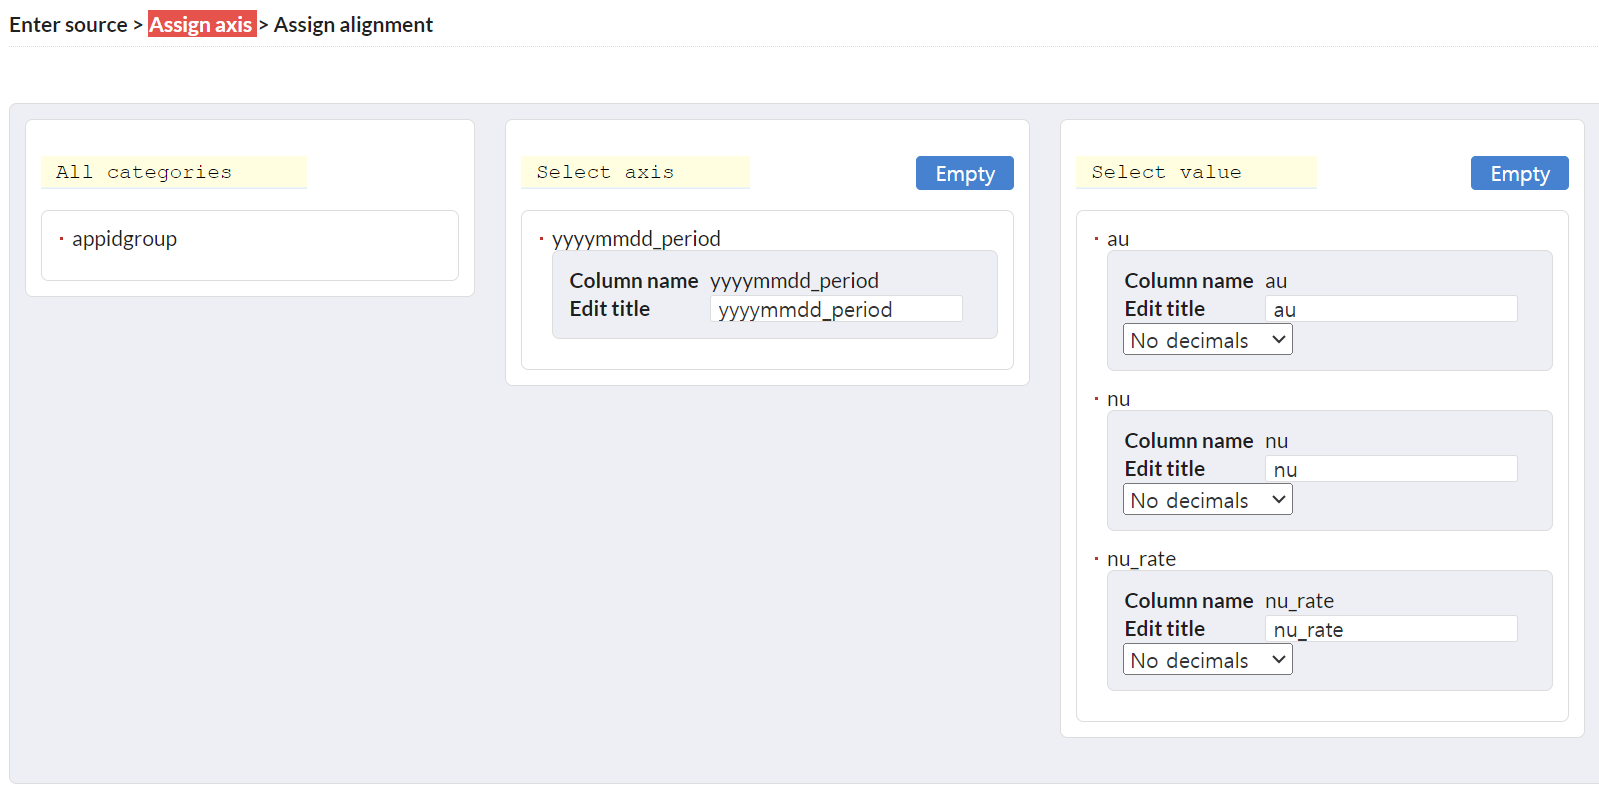
- After specifying the axis and value selections, click Next.
- Axis Selection: yyyymmdd_period
- Value Selection: au, nu, nu_rate
- You can rename each column to your desired names.
- You can adjust the decimal places for each value from none to three decimal places. For “nu_rate,” it’s recommended to set decimals to see the value in detail since it is a percentage value.
- Don’t set sorting or filtering; save the data source.
Step 2: Define Page Source
- Go to Console > Analytics > Management > Page Source and click the “Register Page Source” button.
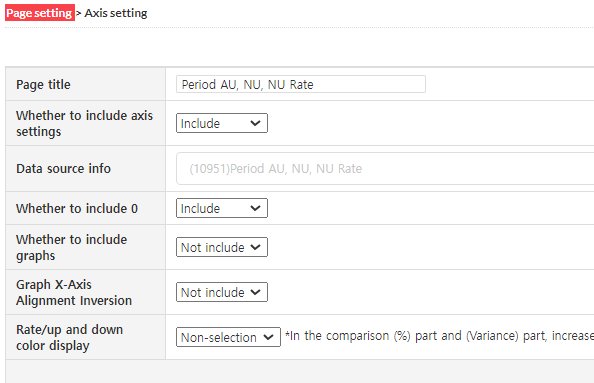
- Enter and select the information below and click Next.
- Enter
- Page Title: Period AU, NU, NU Rate
- Select
- Include Axis Configuration: Include
- Data Source Information: Period AU, NU, NU Rate
- Use default values for other items.
- Enter
- Configure the placement of the axis and values.
- Left: yyyymmdd_period
- Value: au, nu, nu_rate
- You can change the order of values by dragging and dropping. The order determines their position on the left side of the table.
- ∑ Value Location: Above the horizontal axis
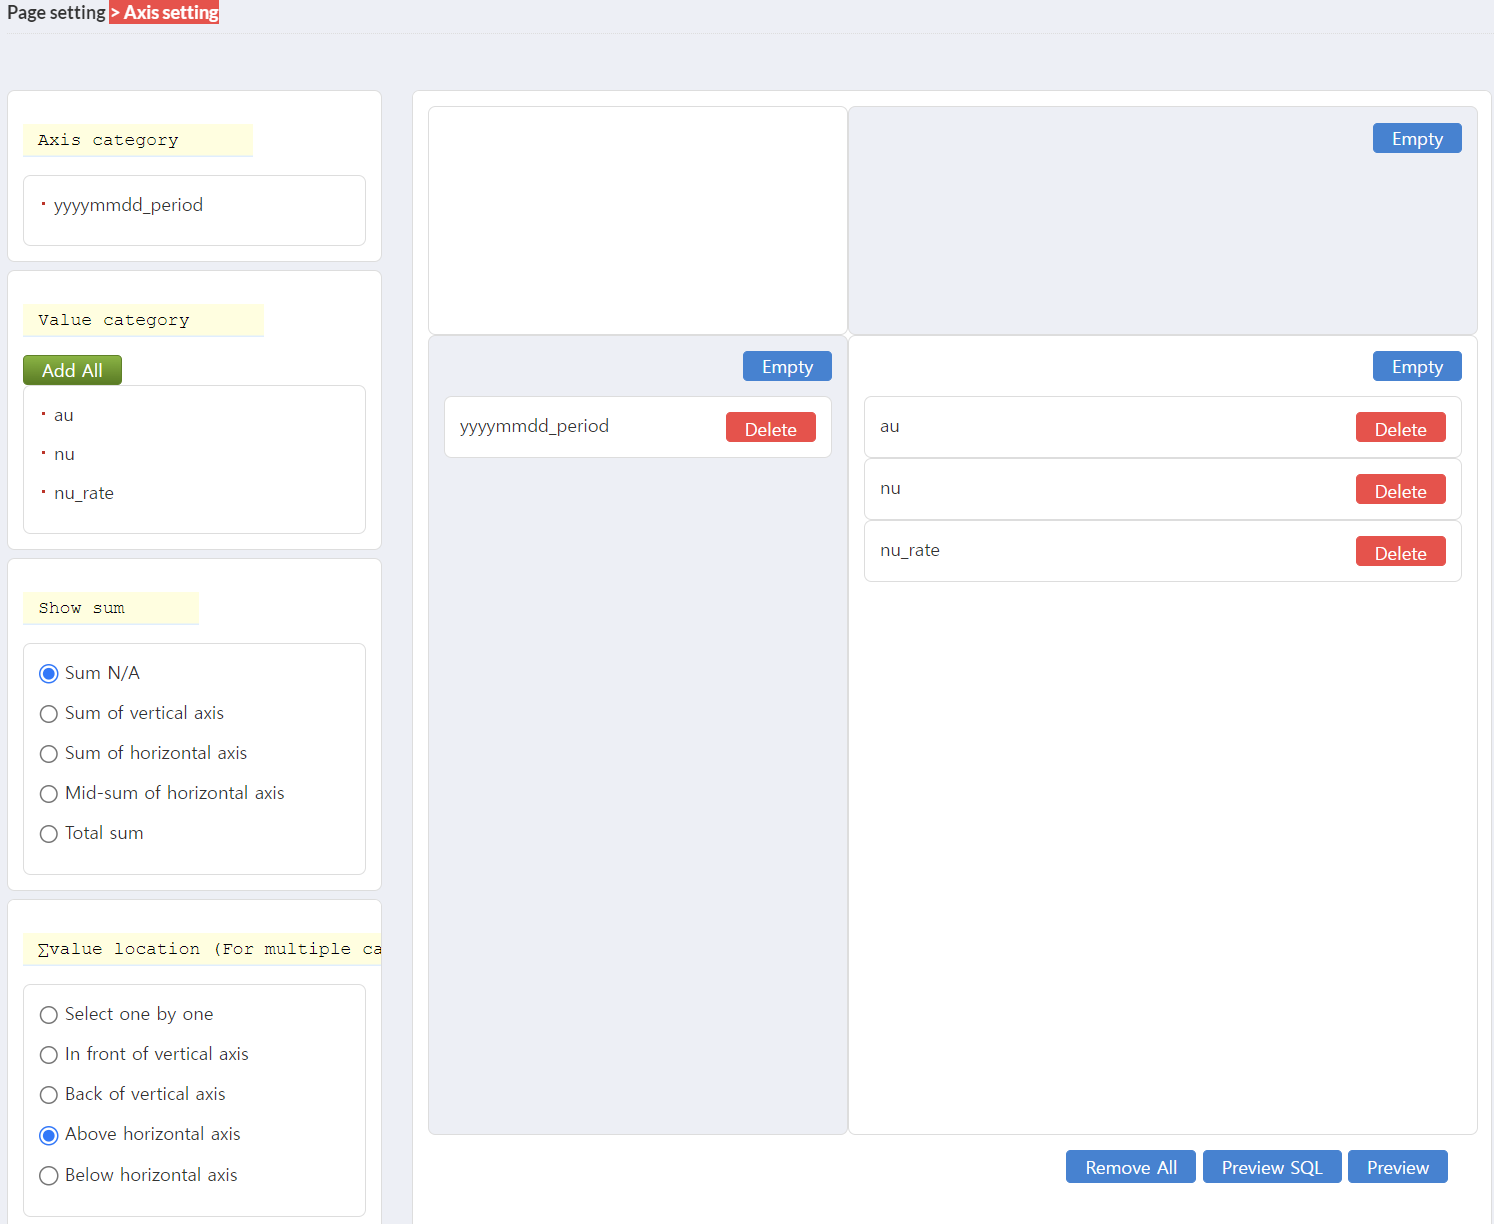
- Click the “Preview” button to ensure that the table displays correctly. Once confirmed, save the page source.
- If you select a particular game in the game-specific indicator, the indicator is displayed under Game-specific Indicator > Custom Indicators, so you must select the game to which you want to apply the indicator.
- Access Console > Analytics > Management > Page Source menu and select “Custom Indicator Application Location” for the Period AU, NU, NU Rate source as the game to which you want to apply the indicator.

- Now, you can access the Period AU, NU, NU Rate indicator in Analytics > Game-specific Indicator > Custom Indicator.
Monthly Stickiness
- Average daily DAU rate to monthly MAU.
- A detailed description of Stickiness can be found here.
- This indicator can also be viewed in Big Query.
- Creating indicators involves two steps: defining a data source and defining a page source.
Step 1: Define Data Source
- Go to Console > Analytics > Manage Indicator > Data Source, and then click the “Register Data Source” Button.
- Select and enter the information below and click Next.
- Select
- Date Range: Monthly
- Data Base: BIGQUERY
- Enter
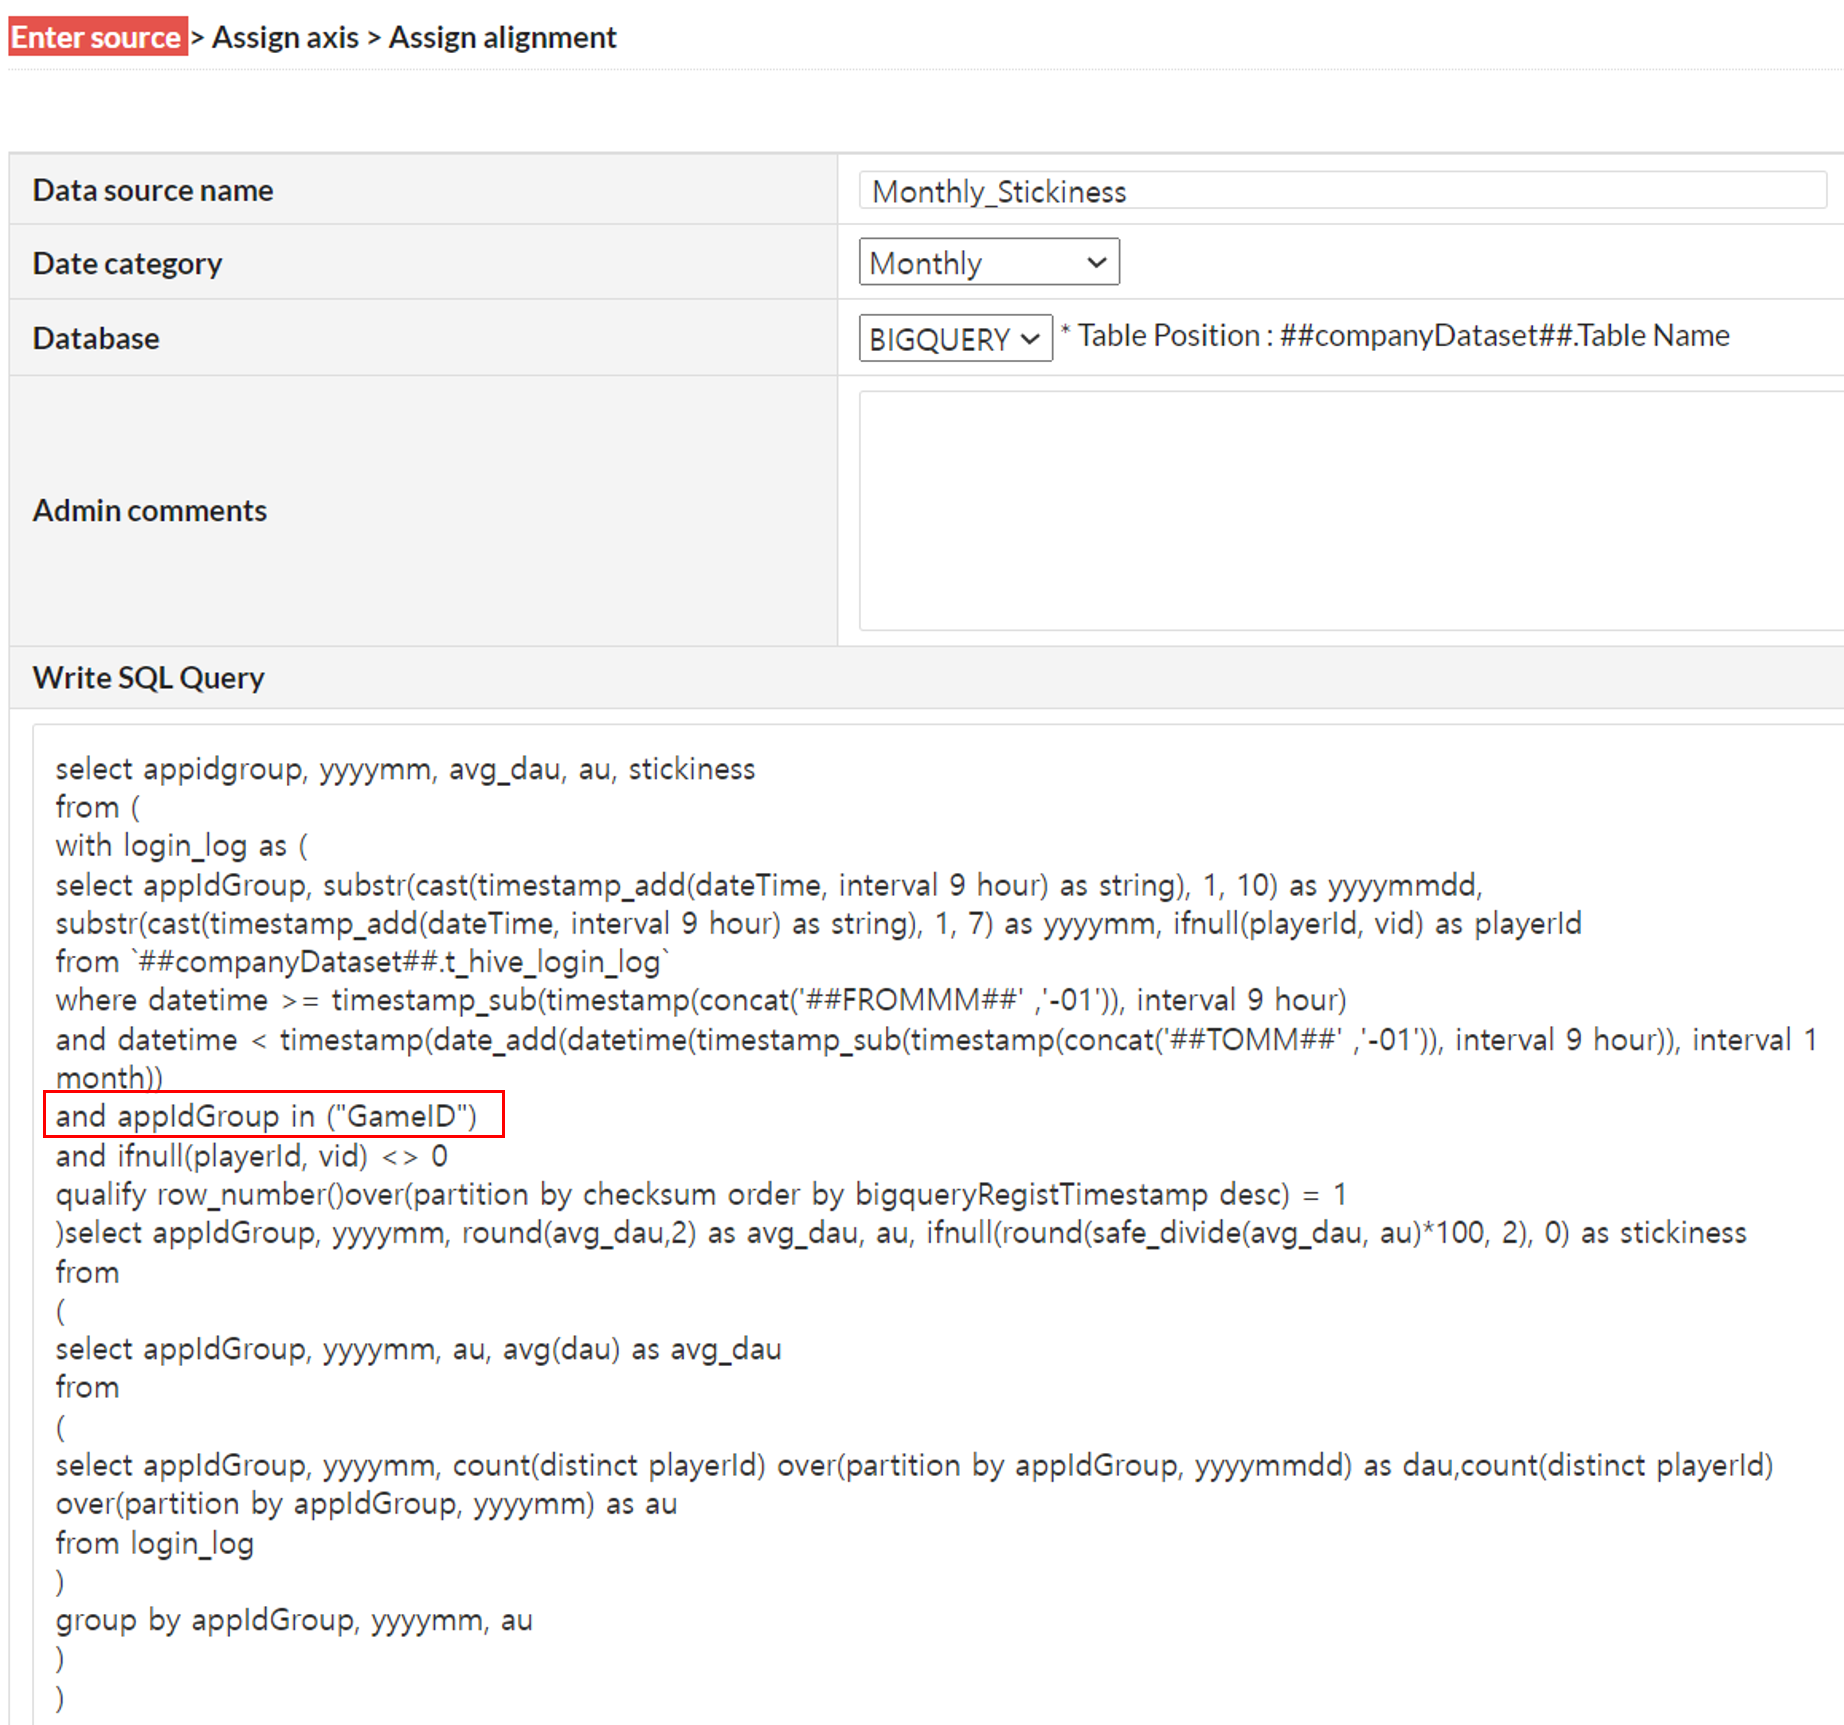
- Data Source Name: Monthly_Stickiness
- Write SQL Query
- Paste the sample query below and modify GameID.
- GameID: The GameID of the game to which the indicator applies in App Center
- Paste the sample query below and modify GameID.
- Select
select appidgroup, yyyymm, avg_dau, au, stickinesswhere datetime >= timestamp_sub(timestamp(concat('##FROMMM##' ,'-01')), interval 9 hour) and datetime < timestamp(date_add(datetime(timestamp_sub(timestamp(concat('##TOMM##' ,'-01')), interval 9 hour)), interval 1 month)) and appIdGroup in ("GameID") and ifnull(playerId, vid) <> 0 qualify row_number()over(partition by checksum order by bigqueryRegistTimestamp desc) = 1 ) select appIdGroup, yyyymm, round(avg_dau,2) as avg_dau, au, ifnull(round(safe_divide(avg_dau, au)*100, 2), 0) as stickiness |
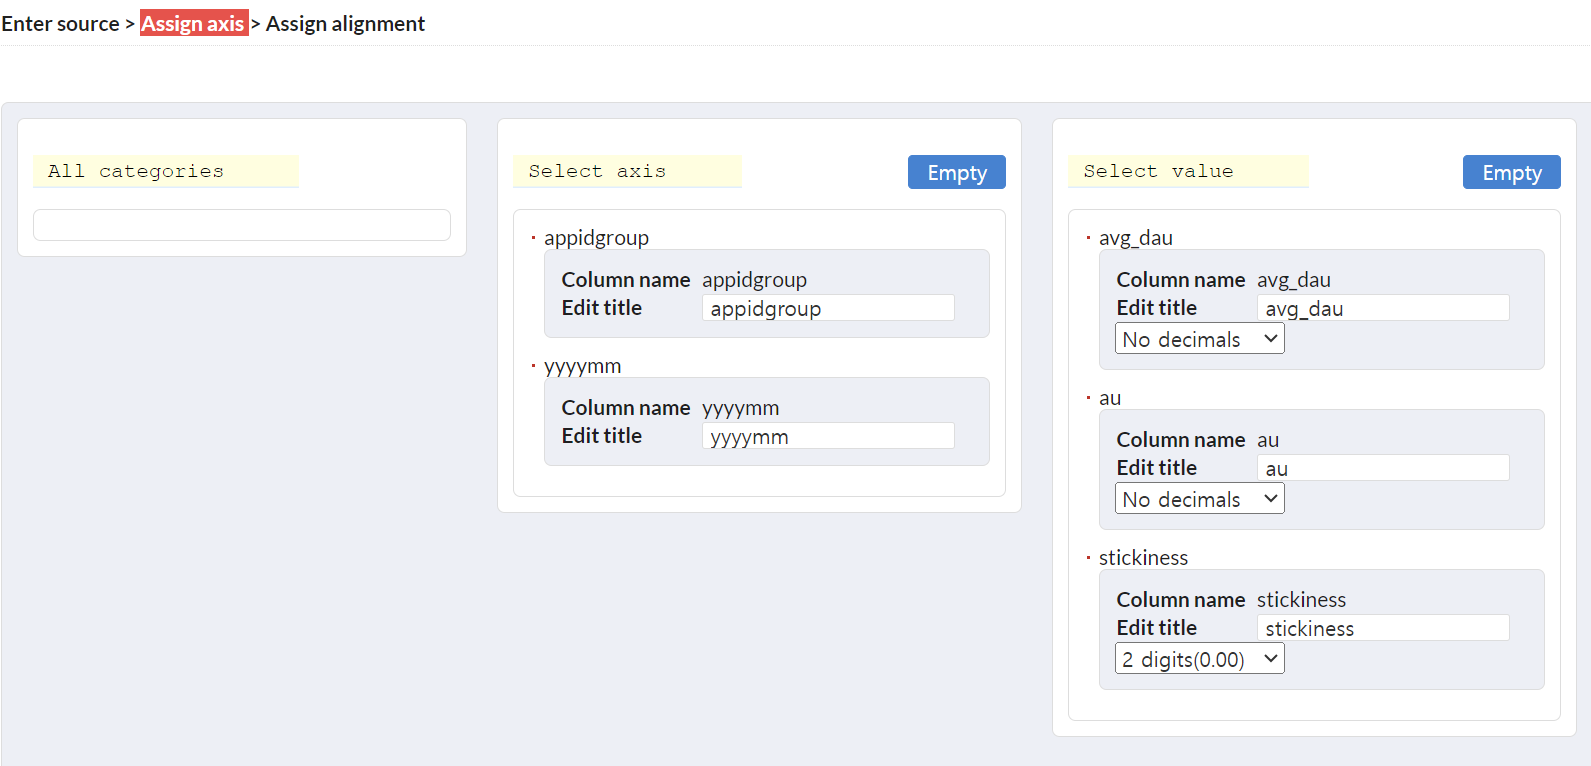
- After specifying the axis and value selections, click Next.
- Axis Selection: yyyymm
- Value Selection: avg_dau, au, stickiness
- You can rename each column to your desired names.
- You can adjust the decimal places for each value from none to three decimal places. For “stickiness” it’s recommended to set decimals to see the value in detail since it is a percentage value.
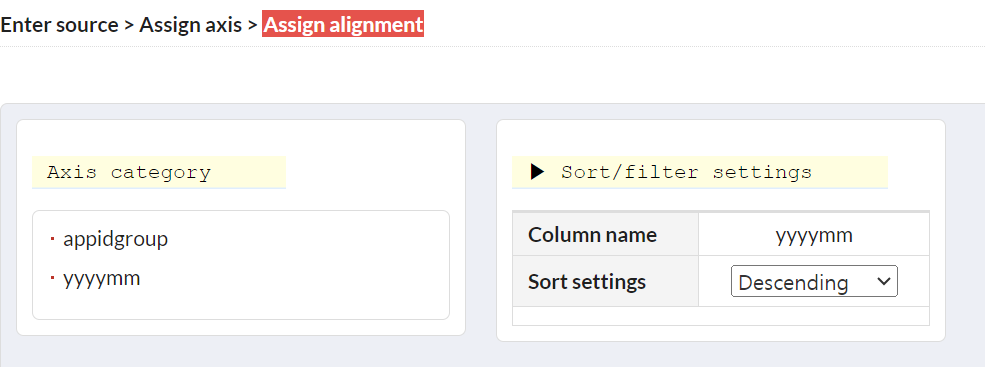
- After configuring the sorting, save the data source.
- yyyymm: Descending Order
Step 2: Define Page Source
- Go to Console > Analytics > Management > Page Source and click the “Register Page Source” button.
- Enter and select the information below and click Next.
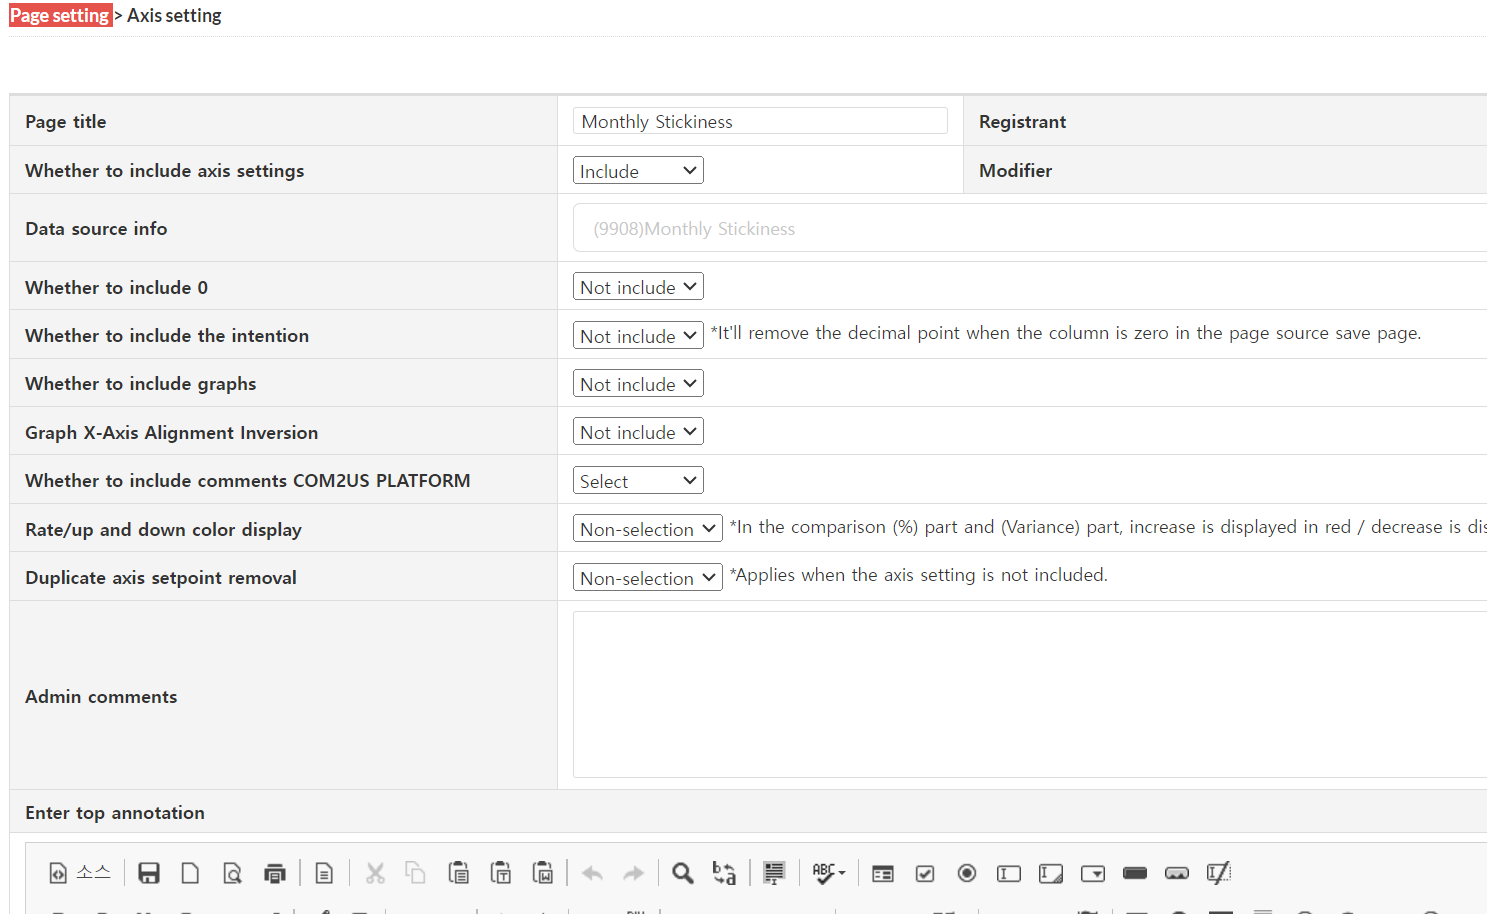
- Enter
- Page Title: Monthly_Stickiness
- Select
- Include Axis Configuration: Include
- Data Source Information: Monthly_Stickiness
- Use default values for other items.
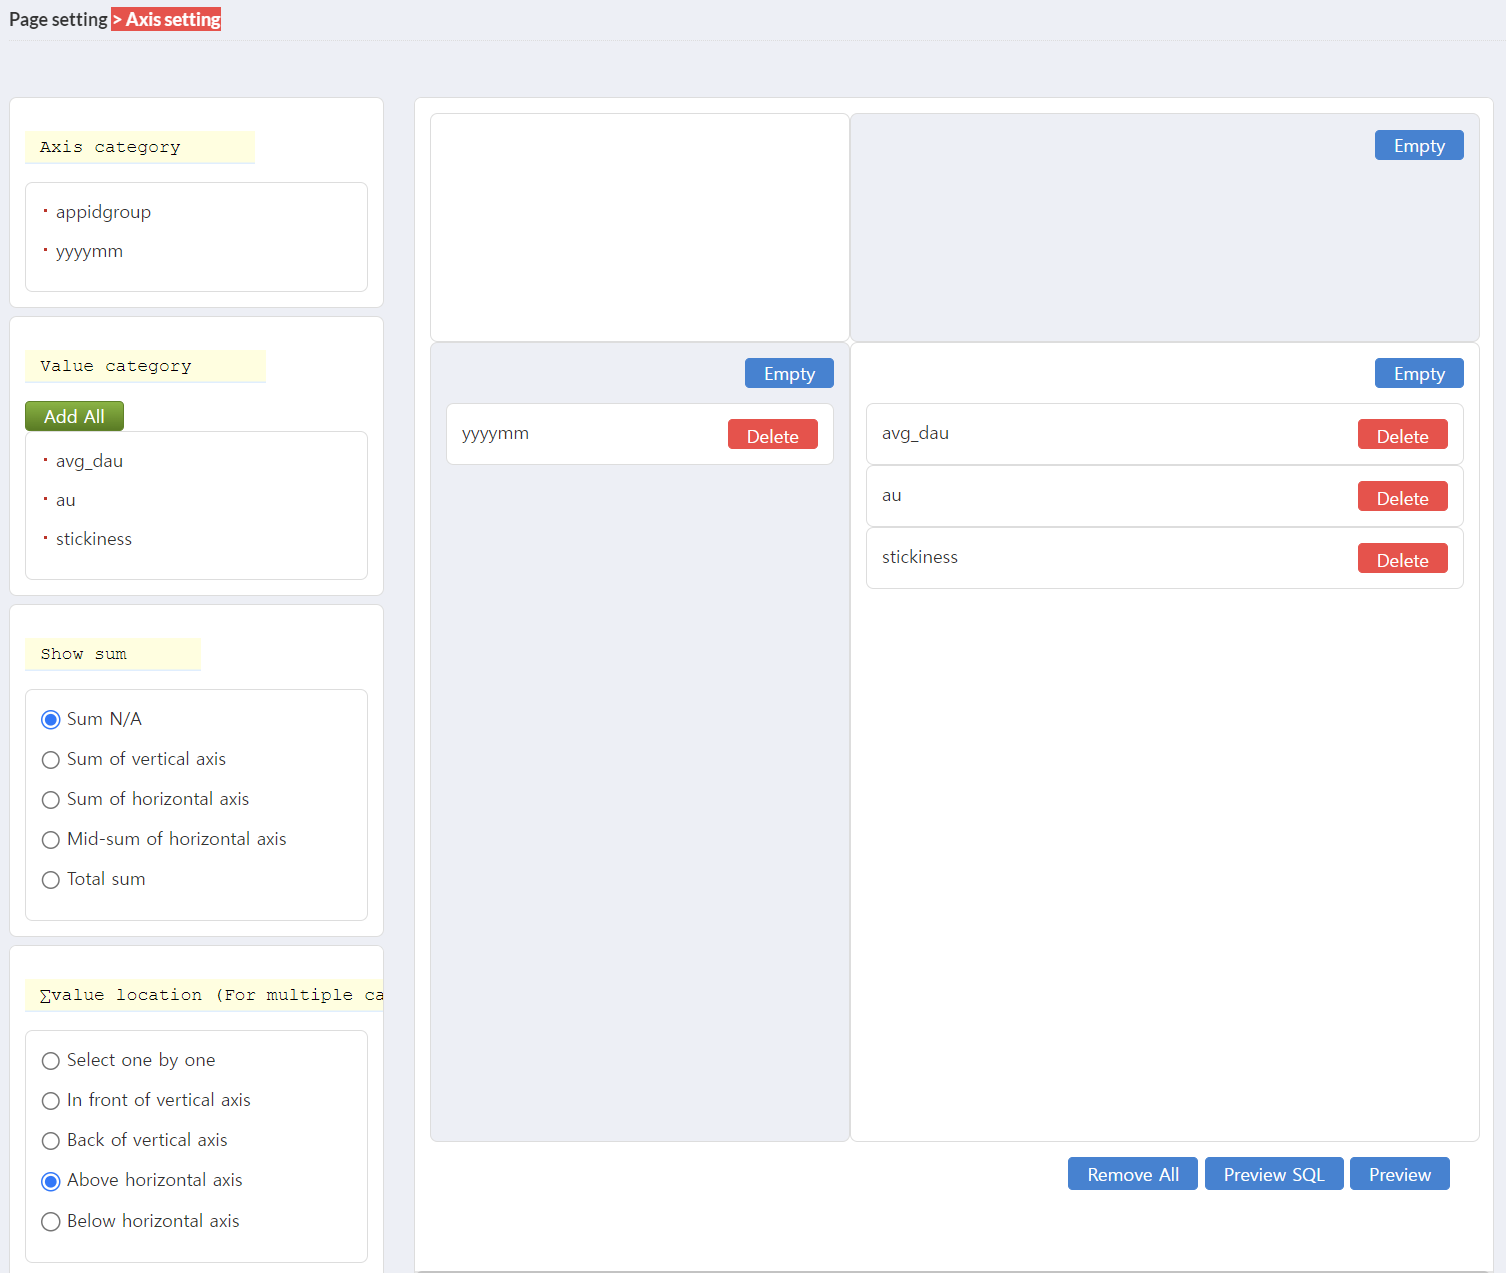
- Enter
- Configure the placement of the axis and values.
- Left: yyyymm
- Value: avg_dau, au, stickiness
- You can change the order of values by dragging and dropping. The order determines their position on the left side of the table.
- ∑ Value Location: Above the horizontal axis
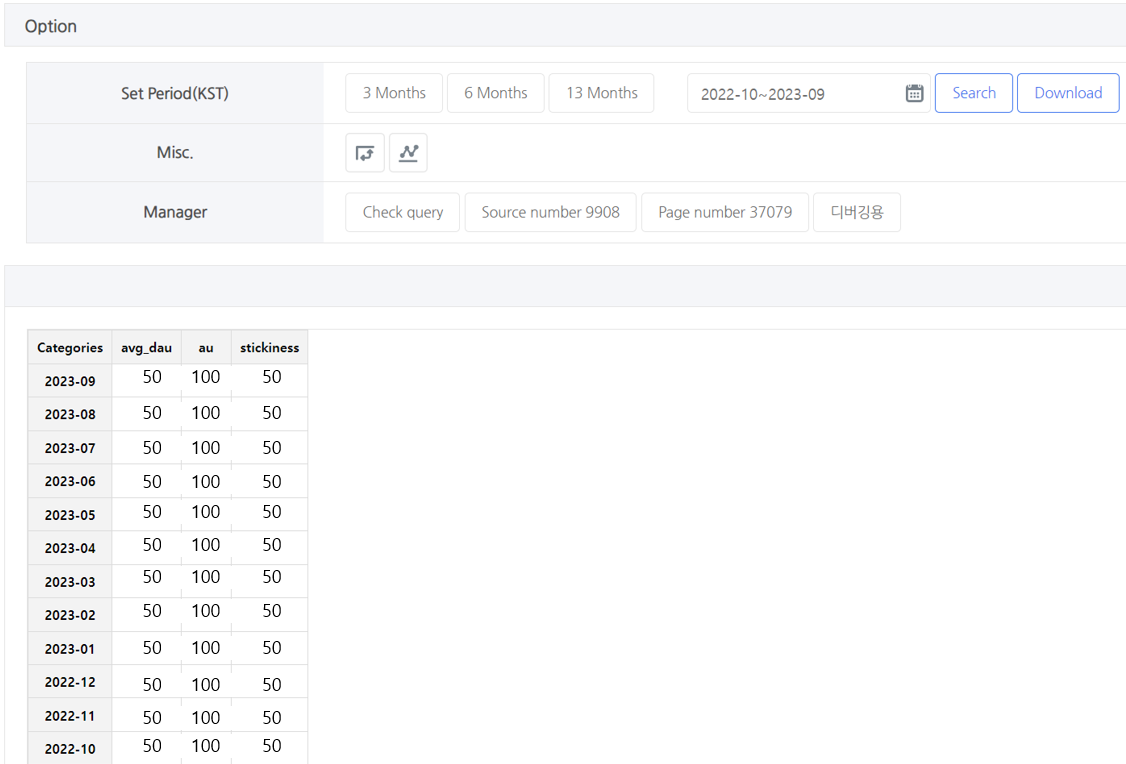
- Click the “Preview” button to ensure that the table displays correctly. Once confirmed, save the page source.
- If you select a particular game in the game-specific indicator, the indicator is displayed under Game-specific Indicator > Custom Indicators, so you must select the game to which you want to apply the indicator.
- Access Console > Analytics > Management > Page Source menu and select “Custom Indicator Application Location” for the Monthly_Stickiness as the game to which you want to apply the indicator.

- Now, you can access the Monthly Stickiness indicator in Analytics > Game-specific Indicator > Custom Indicator.
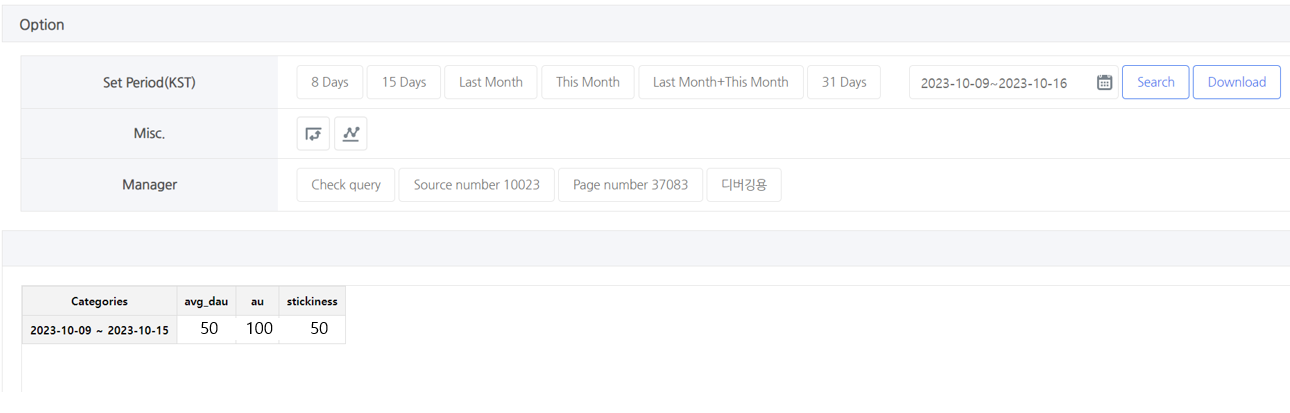
Weekly Stickiness
- Average daily DAU rate to weekly WAU.
- A detailed description of Stickiness can be found here.
- This indicator can also be viewed in Big Query.
- Creating indicators involves two steps: defining a data source and defining a page source.
Step 1: Define Data Source
- Go to Console > Analytics > Manage Indicator > Data Source, and then click the “Register Data Source” Button.
- Select and enter the information below and click Next.
- Select
- Date Range: Daily
- Data Base: BIGQUERY
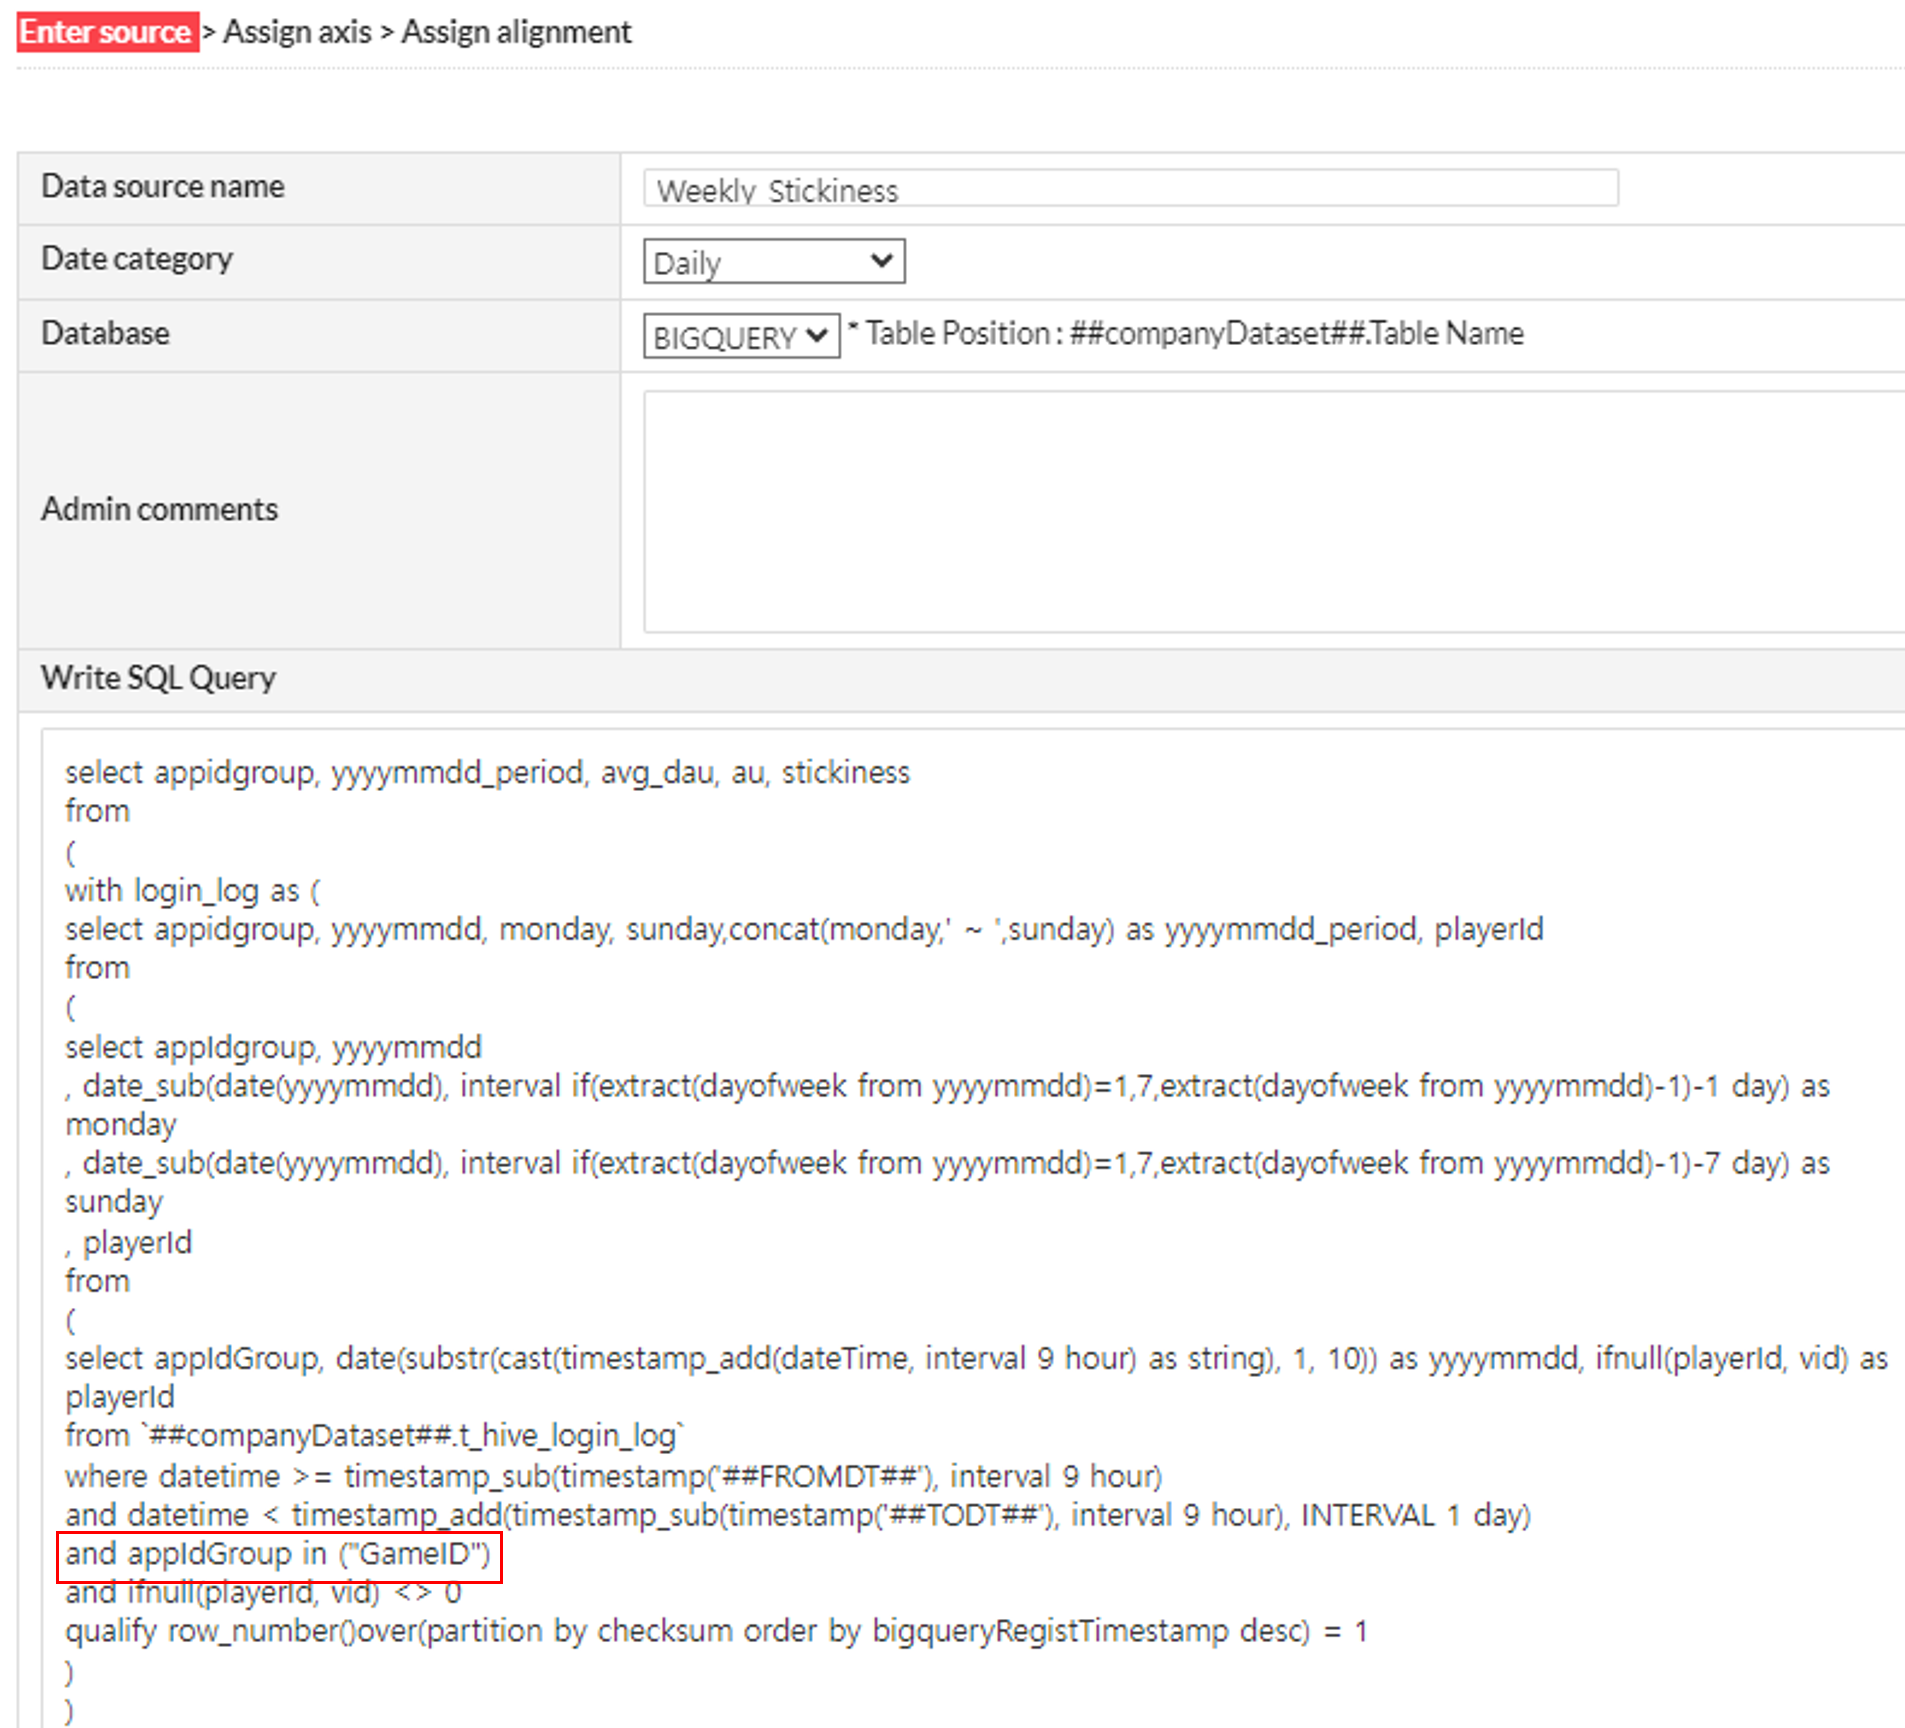
- Enter
- Data Source Name: Weekly_Stickiness
- Write SQL Query
- Paste the sample query below and modify GameID.
- GameID: The GameID of the game to which the indicator applies in App Center
- Paste the sample query below and modify GameID.
- Select
select appidgroup, yyyymmdd_period, avg_dau, au, stickinesswhere datetime >= timestamp_sub(timestamp('##FROMDT##'), interval 9 hour) and datetime < timestamp_add(timestamp_sub(timestamp('##TODT##'), interval 9 hour), INTERVAL 1 day) and appIdGroup in ("GameID") and ifnull(playerId, vid) <> 0 qualify row_number()over(partition by checksum order by bigqueryRegistTimestamp desc) = 1 ) ) where monday >= date('##FROMDT##') and sunday <= date('##TODT##') ) select appIdGroup, yyyymmdd_period, round(avg_dau,2) as avg_dau, au, ifnull(round(safe_divide(avg_dau, au)*100, 2), 0) as stickiness |
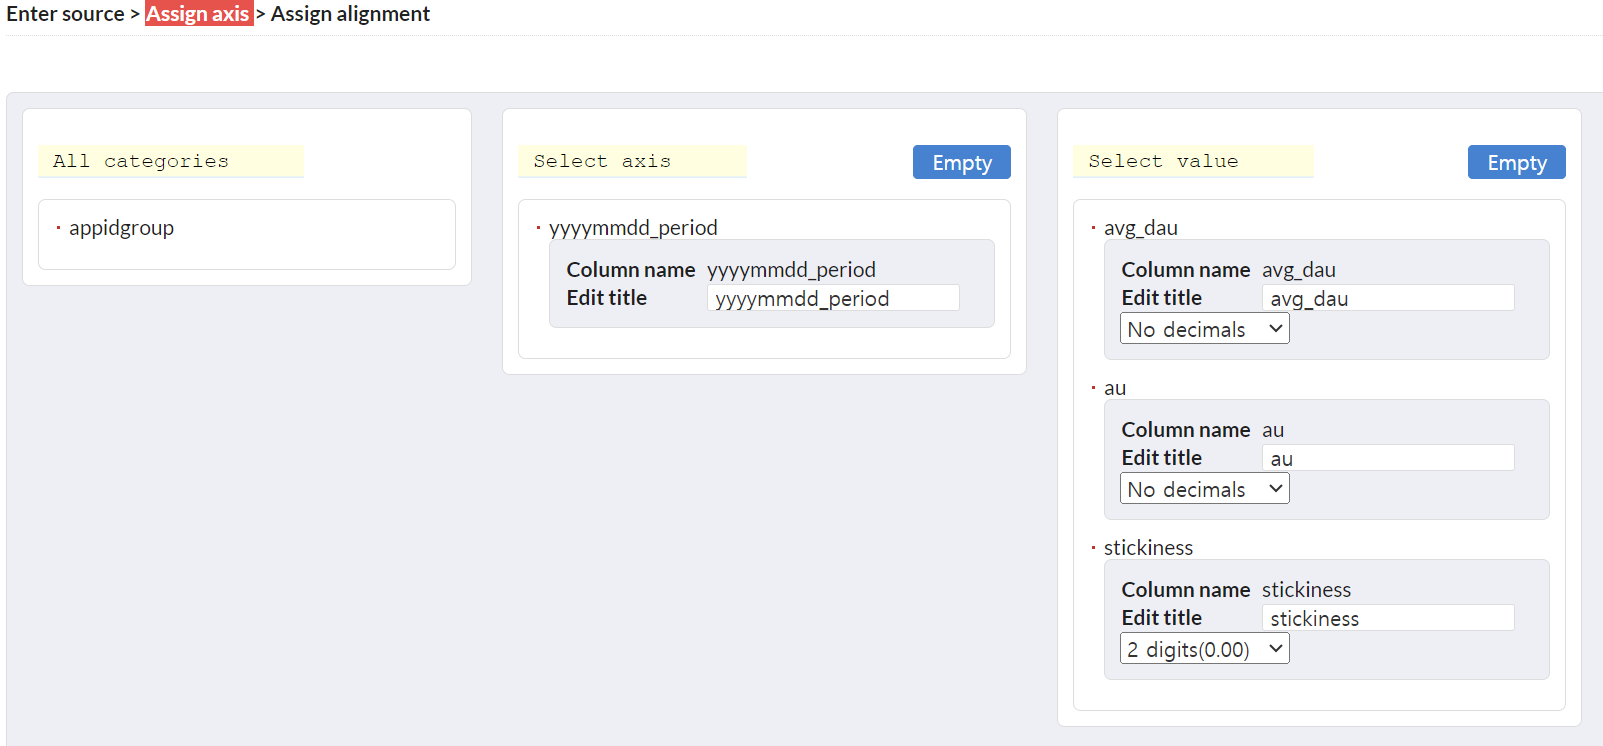
- After specifying the axis and value selections, click Next.
- Axis Selection: yyyymmdd_period
- Value Selection: avg_dau, au, stickiness
- You can rename each column to your desired names.
- You can adjust the decimal places for each value from none to three decimal places. For “stickiness” it’s recommended to set decimals to see the value in detail since it is a percentage value.
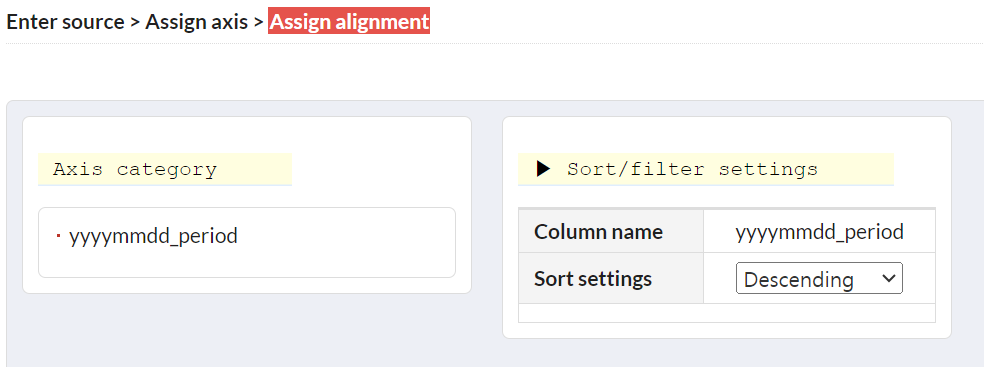
- After configuring the sorting, save the data source.
- yyyymmdd_period : Descending Order
Step 2: Define Page Source
- Go to Console > Analytics > Management > Page Source and click the “Register Page Source” button.
- Enter and select the information below and click Next.
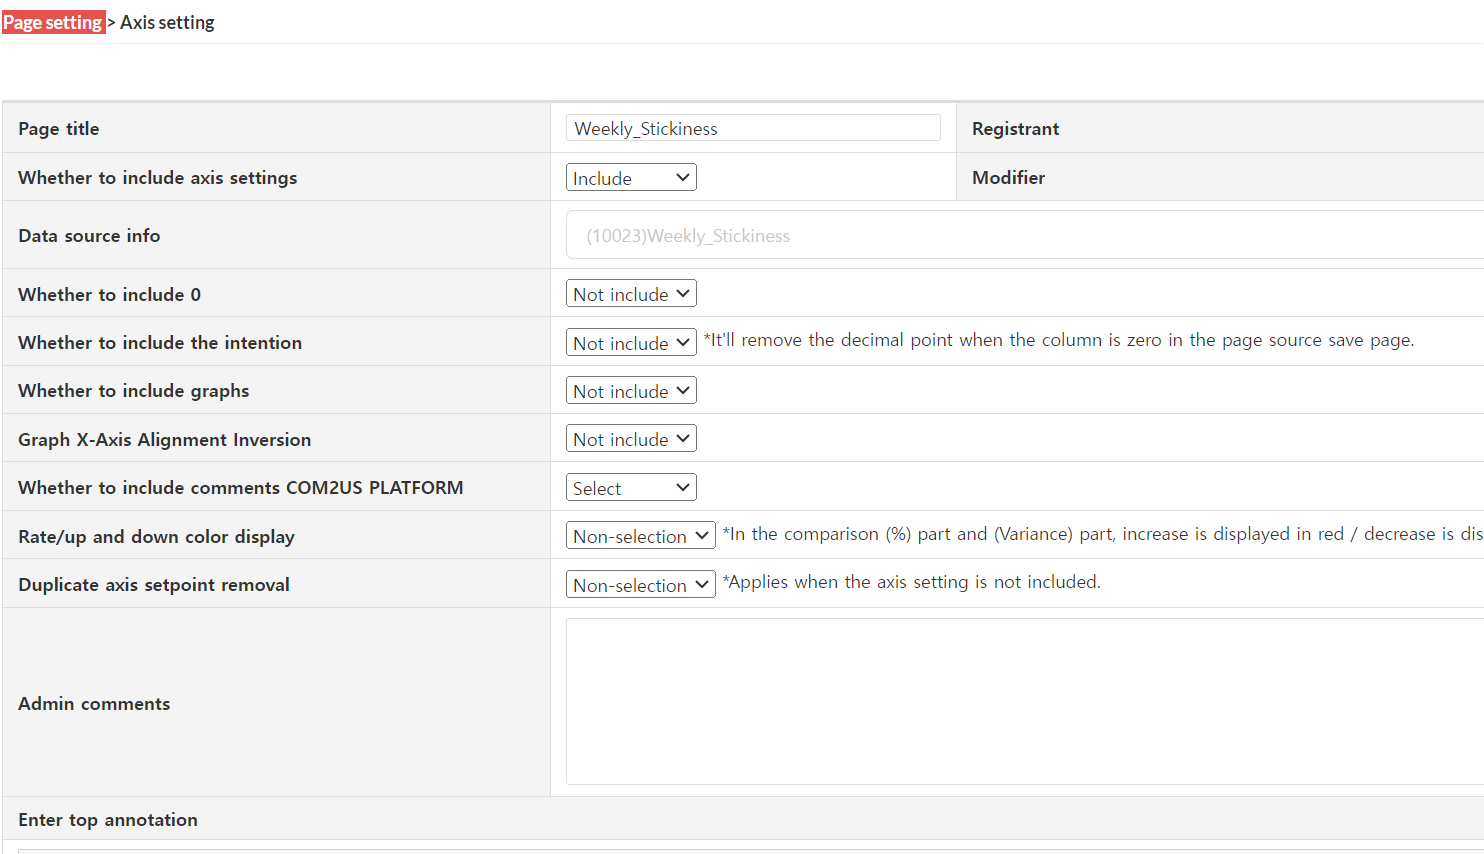
- Enter
- Page Title: Weeky_Stickiness
- Select
- Include Axis Configuration: Include
- Data Source Information: Weeky_Stickiness
- Use default values for other items.
- Enter
- Configure the placement of the axis and values.
- Left: yyyymm
- Value: avg_dau, au, stickiness
- You can change the order of values by dragging and dropping. The order determines their position on the left side of the table.
- ∑ Value Location: Above the horizontal axis
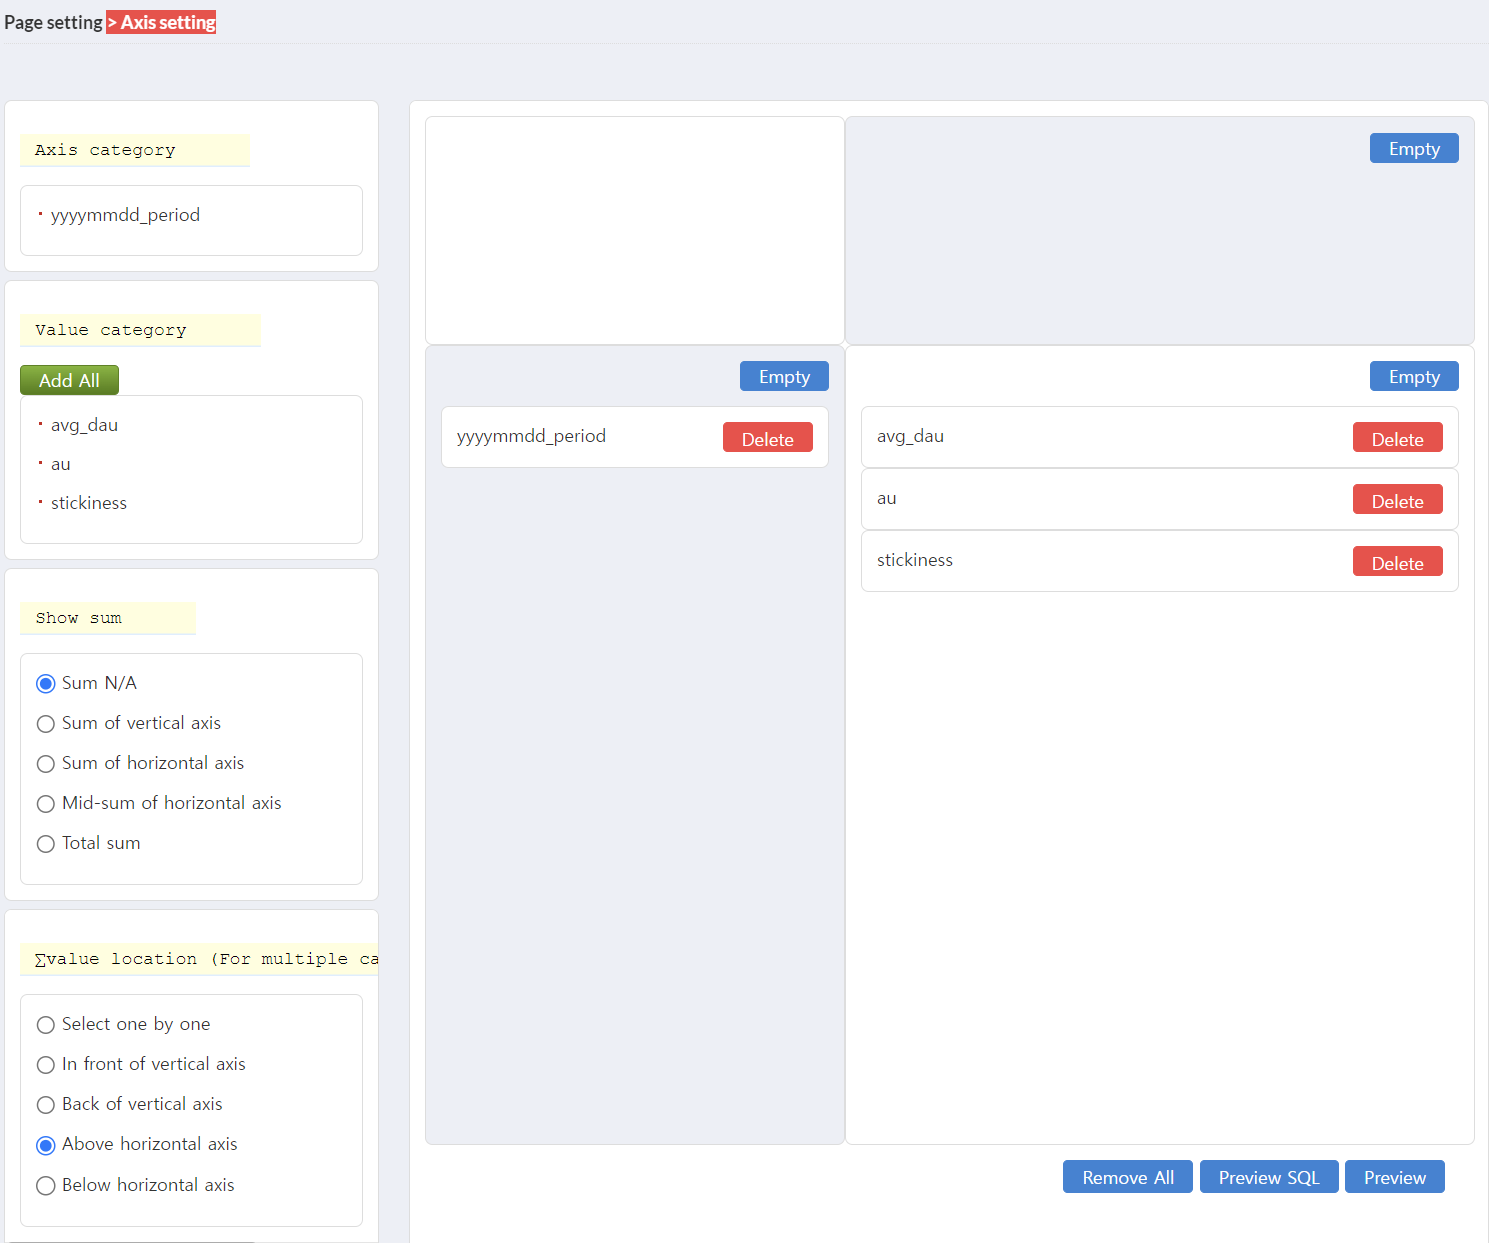
- Click the “Preview” button to ensure that the table displays correctly. Once confirmed, save the page source.
- If you select a particular game in the game-specific indicator, the indicator is displayed under Game-specific Indicator > Custom Indicators, so you must select the game to which you want to apply the indicator.
- Access Console > Analytics > Management > Page Source menu and select “Custom Indicator Application Location” for the Weekly_Stickiness as the game to which you want to apply the indicator.

- Now, you can access the Weekly Stickiness indicator in Analytics > Game-specific Indicator > Custom Indicator.