Refer to the below guide and this guide for a better understanding.
Stickiness Indicator
-
Definition
- The stickiness indicator measures the frequency with which users access the game. If the stickiness indicator is high, new user LTV, retention, and whale/dolphin classification type user ratio tend to be high, and this can be concluded that the game activation level is high. In contrast, if the stickiness indicator is low, the indicator’s value tends to be low and can be concluded that the game activation level is low.
-
Calculation Formula
- stickiness can be calculated on a weekly or monthly basis, and the calculation formula is as follows:
- Weekly Stickiness (%) = (Average DAU for 1 week / WAU) * 100
- Monthly Stickiness (%) = (Average DAU for 1 month / MAU) * 100
- E.g. If the MAU is 10,000 and the average DAU is 1,000 from Jun. 1st, 2023, to Jun. 30th, 2023, the Monthly Stickiness would be 10%.
- stickiness can be calculated on a weekly or monthly basis, and the calculation formula is as follows:
How to Apply to Games
- You can track the trend of game activation and consider appropriate actions based on the increase or decrease in stickiness by regularly checking the stickiness weekly or monthly,
-
How to calculate stickiness
-
- Search for WAU (or MAU for monthly stickiness) in the summarized indicator
- In the Indicator by Game > Dashboard > Summarized Indicator Dashboard, set the period condition to Weekly (Monthly for monthly stickiness) and select the period within the range of weeks (months) for which you wish to calculate the stickiness indicator, then click the Search button.
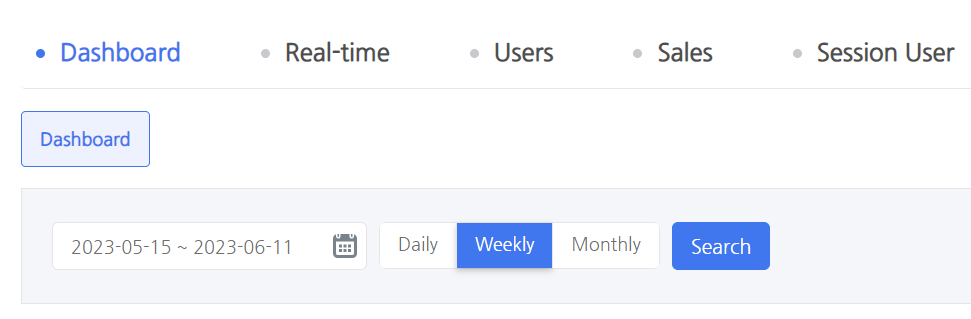
- In the Indicator by Game > Dashboard > Summarized Indicator Dashboard, set the period condition to Weekly (Monthly for monthly stickiness) and select the period within the range of weeks (months) for which you wish to calculate the stickiness indicator, then click the Search button.
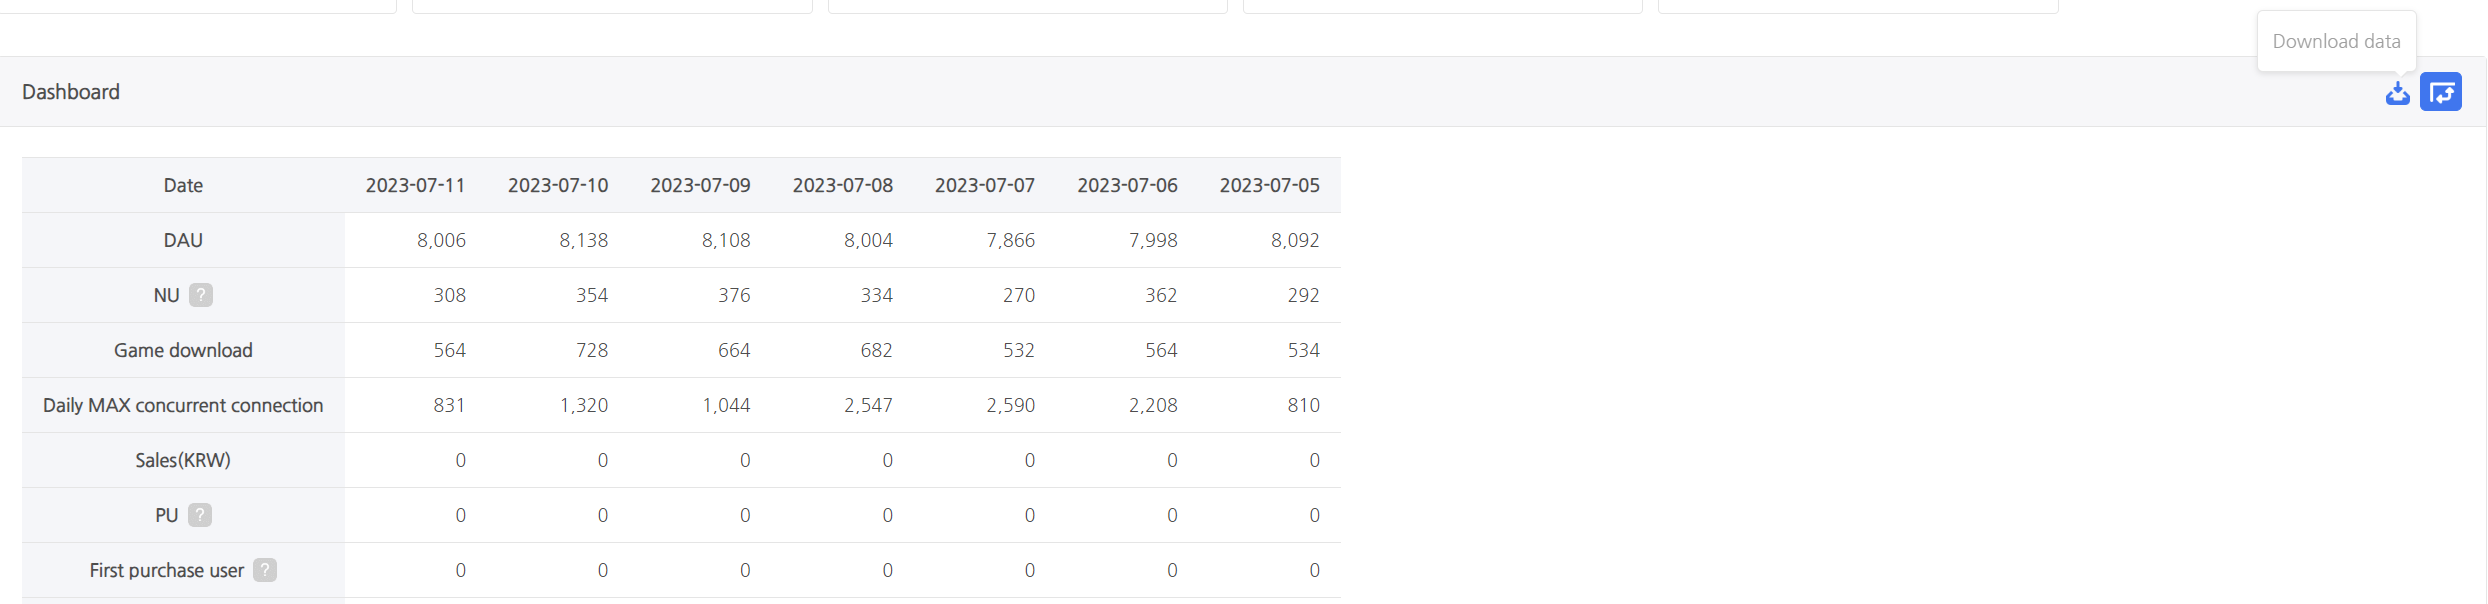
- Download the WAU (MAU for monthly stickiness) indicator value
- Check the exposed WAU (MAU for monthly stickiness) indicator values or click the Download Data button to the right of the summarized indicator to download the data as a csv file.
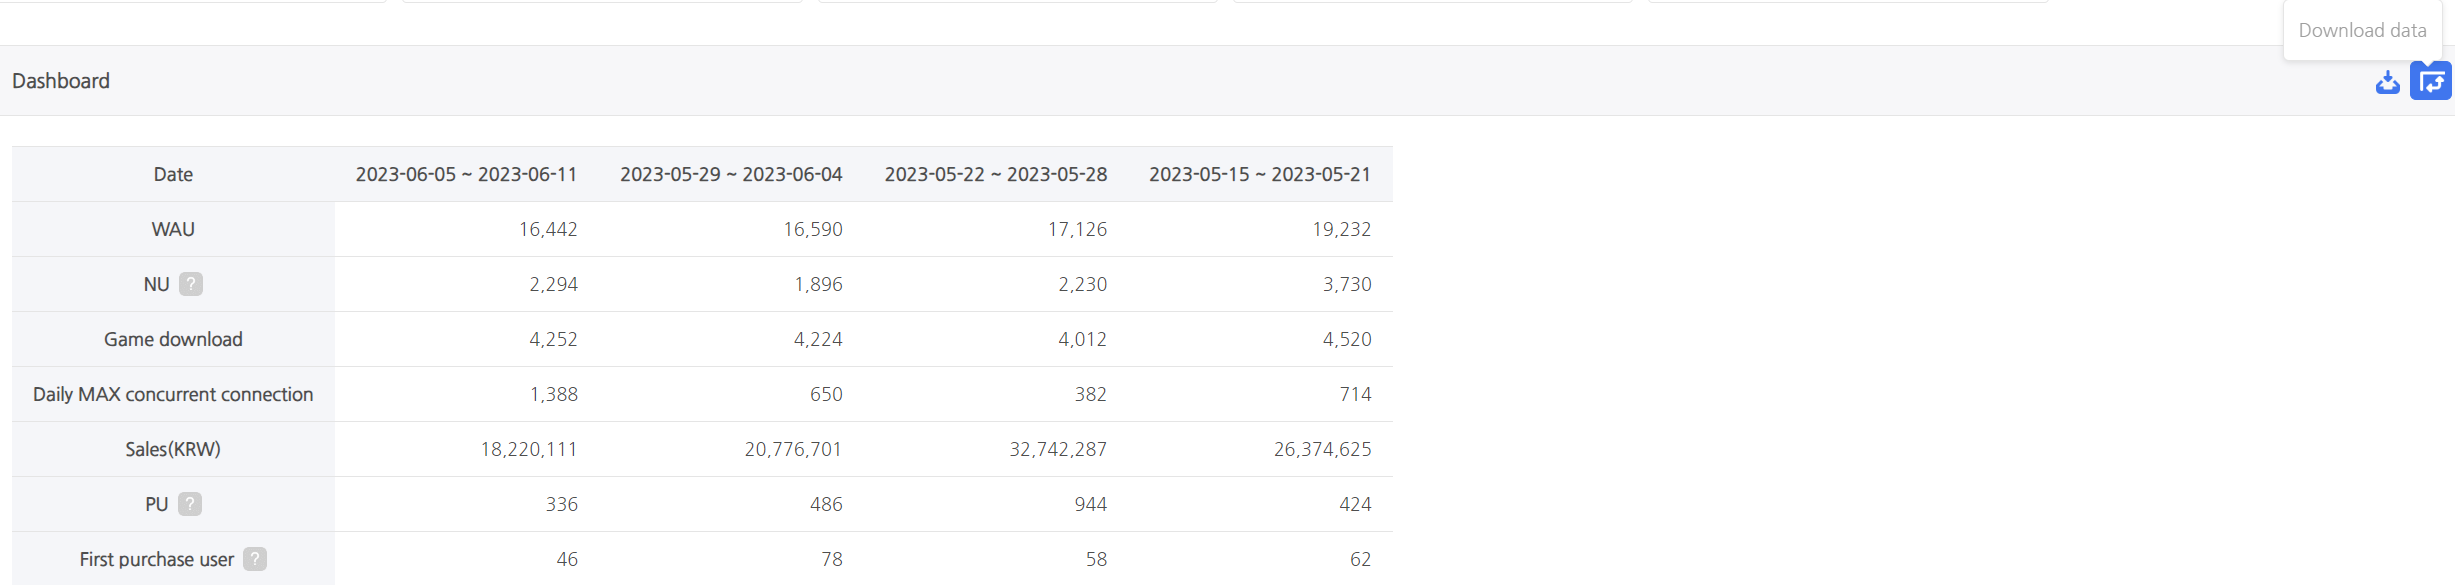
- Check the exposed WAU (MAU for monthly stickiness) indicator values or click the Download Data button to the right of the summarized indicator to download the data as a csv file.
- Search for DAU in the summarized indicator
- Click the Search button after changing the period to days and specifying the period as a range of days. In this instance, select the same period for which the WAU (MAU for monthly stickiness) indicator was looked up in step 1.
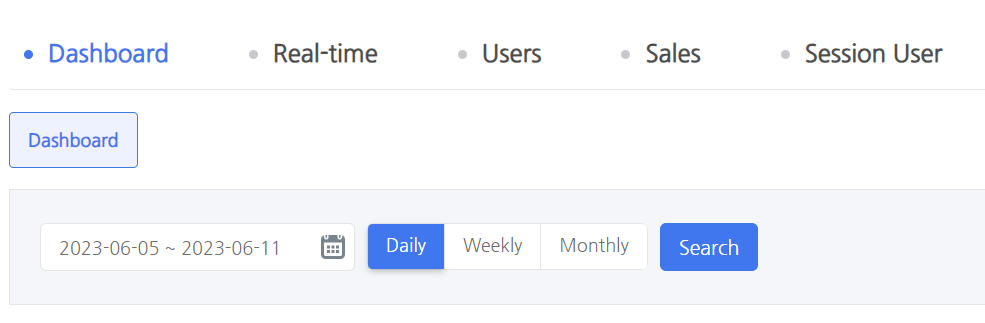
- E.g. When calculating the weekly stickiness, check the WAU value for the period from Jun. 5th, 2023 to Jun. 11th, 2023 in the weekly indicator, and in the period from Jun. 5th, 2023 to Jun. 11th, 2023 in the daily indicator to view the DAU indicator.
- Click the Search button after changing the period to days and specifying the period as a range of days. In this instance, select the same period for which the WAU (MAU for monthly stickiness) indicator was looked up in step 1.
- Download DAU value
- Download the data as a csv file in the same ways as in 2.
- Calculating average DAU using Excel
- Calculate the average DAU using the csv file downloaded from 4.
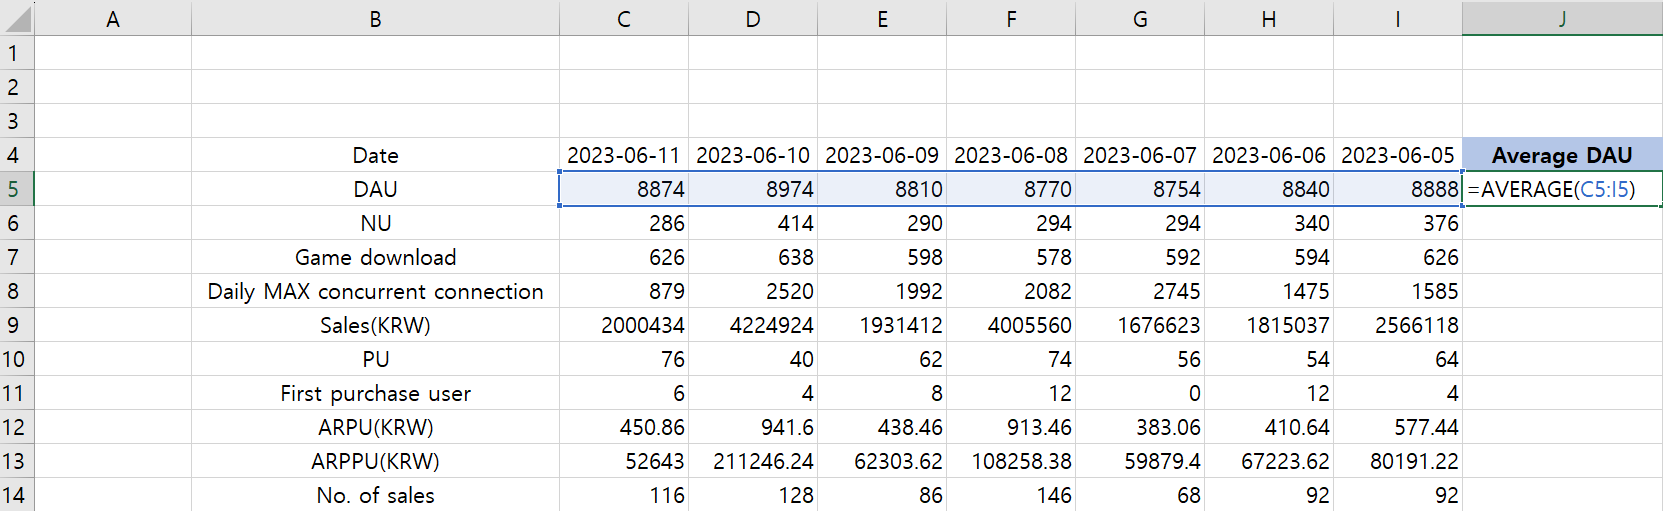
- Calculate the average DAU using the csv file downloaded from 4.
- Calculating stickiness using Excel
- Calculate the stickiness using the average DAU value calculated in step 5. and the WAU (MAU for the monthly stickiness) value confirmed in 2.
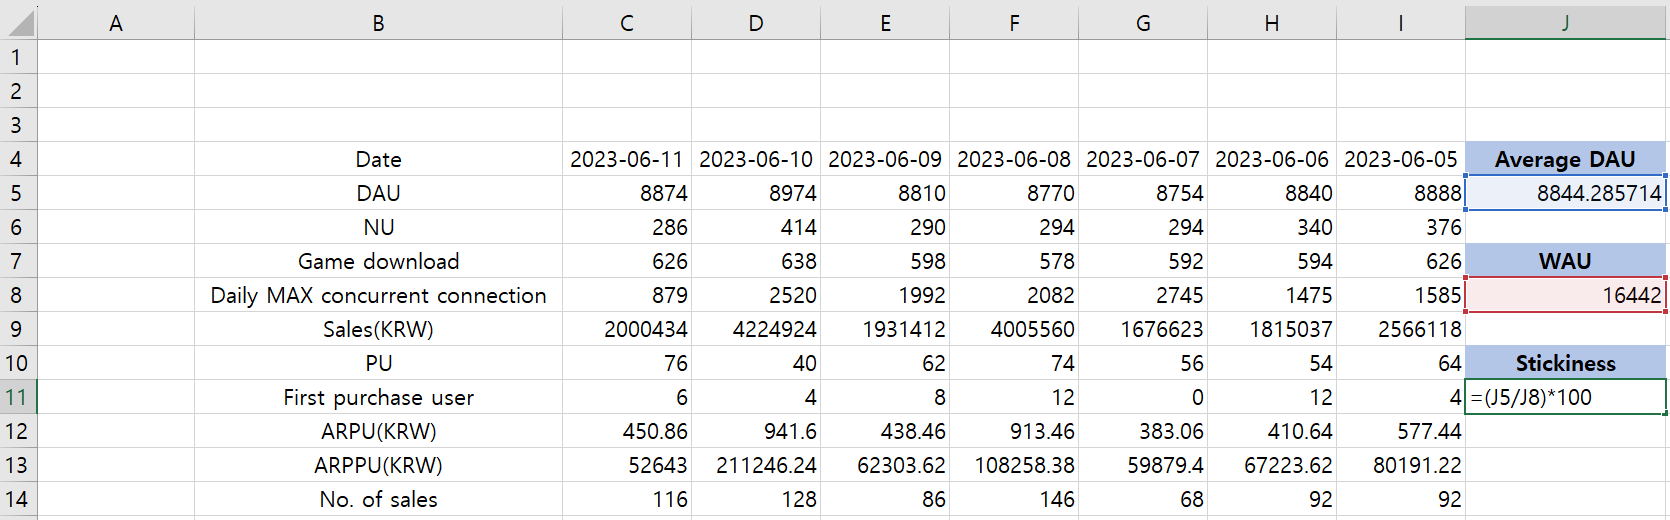
- Calculate the stickiness using the average DAU value calculated in step 5. and the WAU (MAU for the monthly stickiness) value confirmed in 2.
- Search for WAU (or MAU for monthly stickiness) in the summarized indicator
-
How to use the stickiness indicator by circumstance
-
If the stickiness decreases
- If the influx of NU increases as a result of a game update or marketing action, the ratio of NU to DAU (%) may increase, while the stickiness may decrease. You can also determine whether there were any updates, game events, promotions, etc. during a specific time period.
- How to calculate the ratio (%) of NU to DAU
- Go to Indicator by Game > Dashboard > Summary Indicator Dashboard and click the Download Data for DAU and NU value.
- Calculate the NU to DAU ratio (percent) using the downloaded CSV file as shown below.
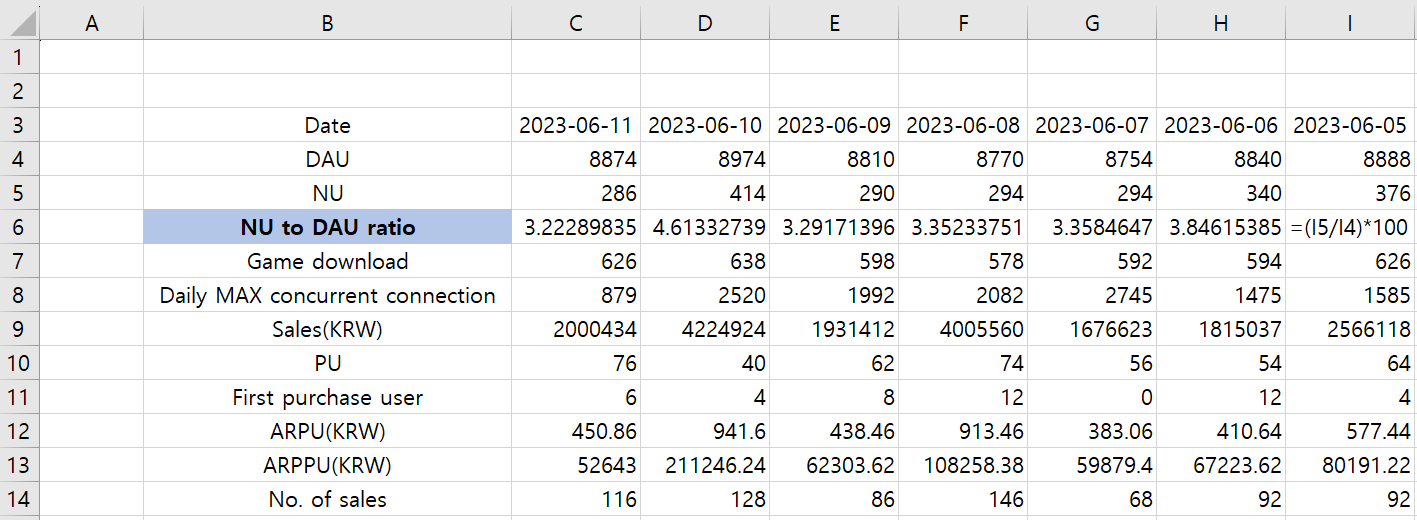
- Go to Indicator by Game > Dashboard > Summary Indicator Dashboard and click the Download Data for DAU and NU value.
- How to calculate the ratio (%) of NU to DAU
- If the ratio of new active users increases, it indicates that the ratio of users who log in for only one day on the day of new inflow and do not log in increases, which can cause the stickiness indicator to decrease (The classification indicator is displayed based on the user’s most recent classification type within the specified time frame). Check the user’s exit point using the game entry funnel analysis, which includes the tutorial play record, at this time.
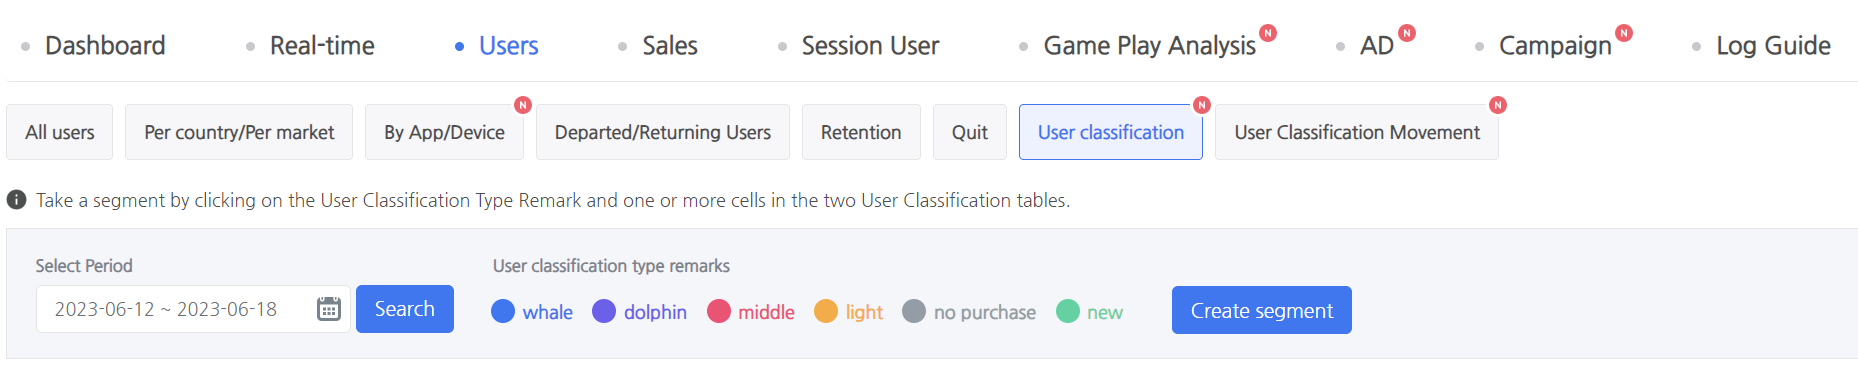
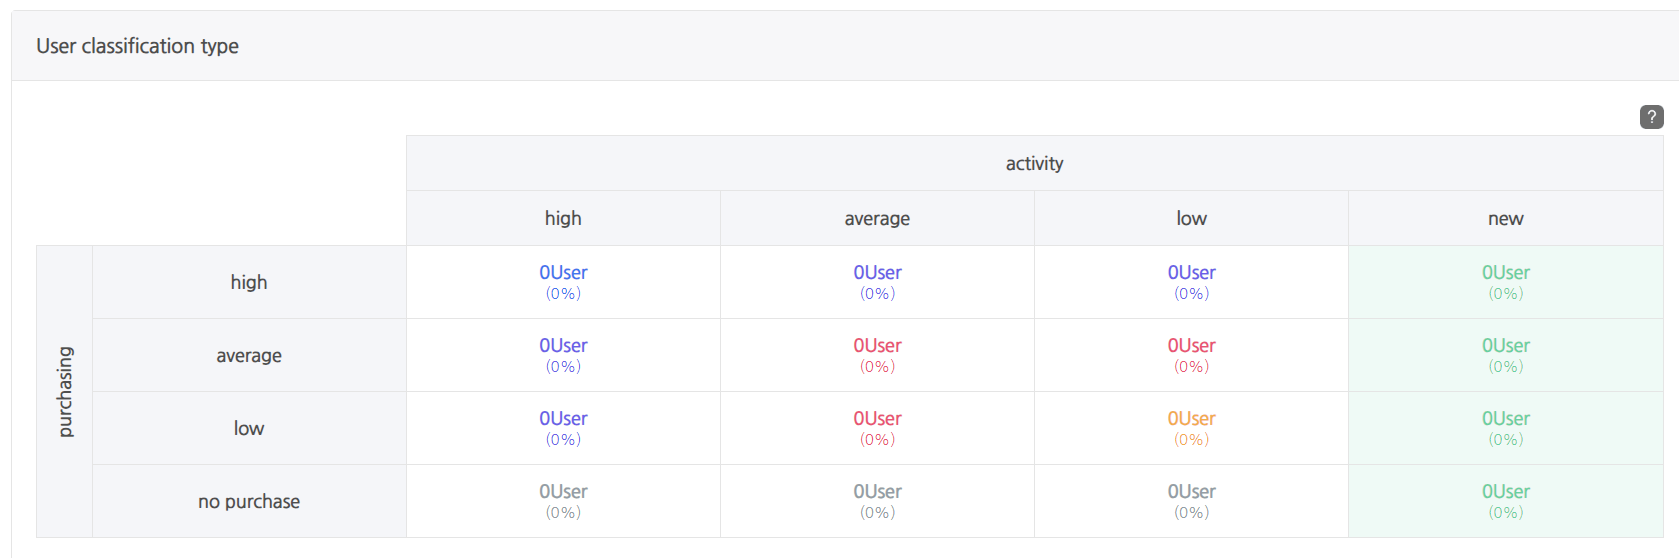
- How to check the ratio of active new users in a user classification indicator
- Enter Indicator by Game > User > User Classification Dashboard.
- Set the indicator query date to the week in which the stickiness increased (month for monthly stickiness) and the week prior to that week to check the indicator.
- Set the indicator query date to Jun. 5th to Jun. 11th and May 29th to Jun. 4th if the stickiness from Jun. 5th to Jun. 11th was lower than the stickiness from May 29th to Jun. 4th.
- Check the variation in the ratio of new active users.
- Enter Indicator by Game > User > User Classification Dashboard.
- How to check the ratio of active new users in a user classification indicator
- If the ratio of users who moved from the whale and dolphin classification types to the middle, light, no purchase, and offline classification types increases, it indicates a decrease in the ratio of users with “high” activity, and the stickiness may decrease accordingly. Before the stickiness decreases, you can establish a segment targeting whale and dolphin classification type users and consider conducting a targeting campaign for those users in order to increase the stickiness.
- How to check the user classification movement indicator
- Indicator by game > Player > User Go to user classification Proceed to the dashboard.
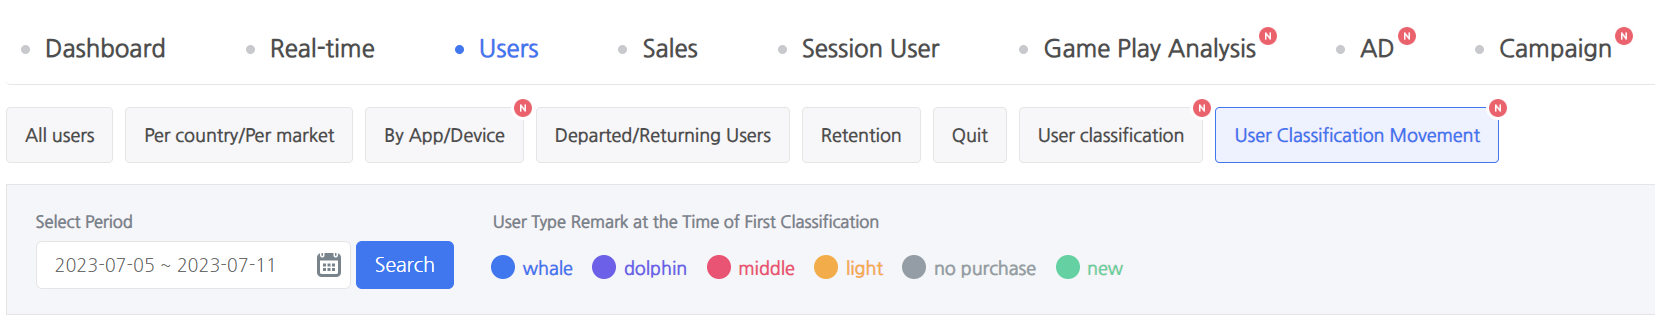
- Set the indicator query date to the week in which the stickiness increased (month for monthly stickiness) and the week prior to that week to check the indicator.
- Set the indicator query date to Jun. 5th to Jun. 11th and May 29th to Jun. 4th if the stickiness from Jun. 5th to Jun. 11th was lower than the stickiness from May 29th to Jun. 4th.
- Check the changes in the number and ratio of users who migrated from the whale and dolphin classification types to the middle, light, no purchase and offline classification types.
- Indicator by game > Player > User Go to user classification Proceed to the dashboard.
- How to check the user classification movement indicator
- A decrease in the retention value implies a decline in the ratio of returning users, which is correlated with a decline in the stickiness. The decrease in retention value can be caused by a number of factors, including a lack of in-game content, challenging content, and in-game currency abuse. You can further analyze the cause of the decrease in retention using Indicator by Game > Gameplay Analysis Indicator, and you can consider improving the stickiness and the retention.
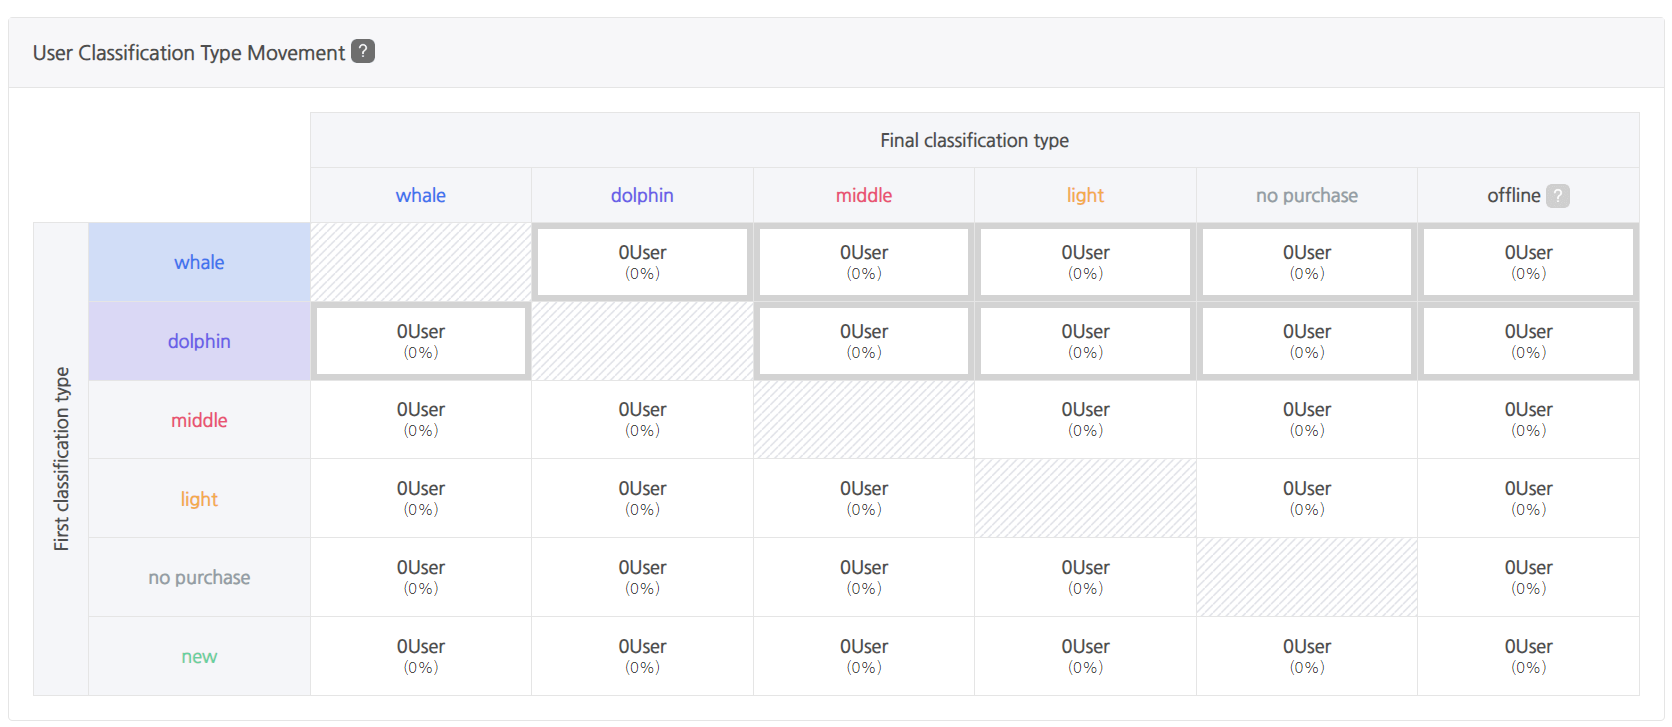
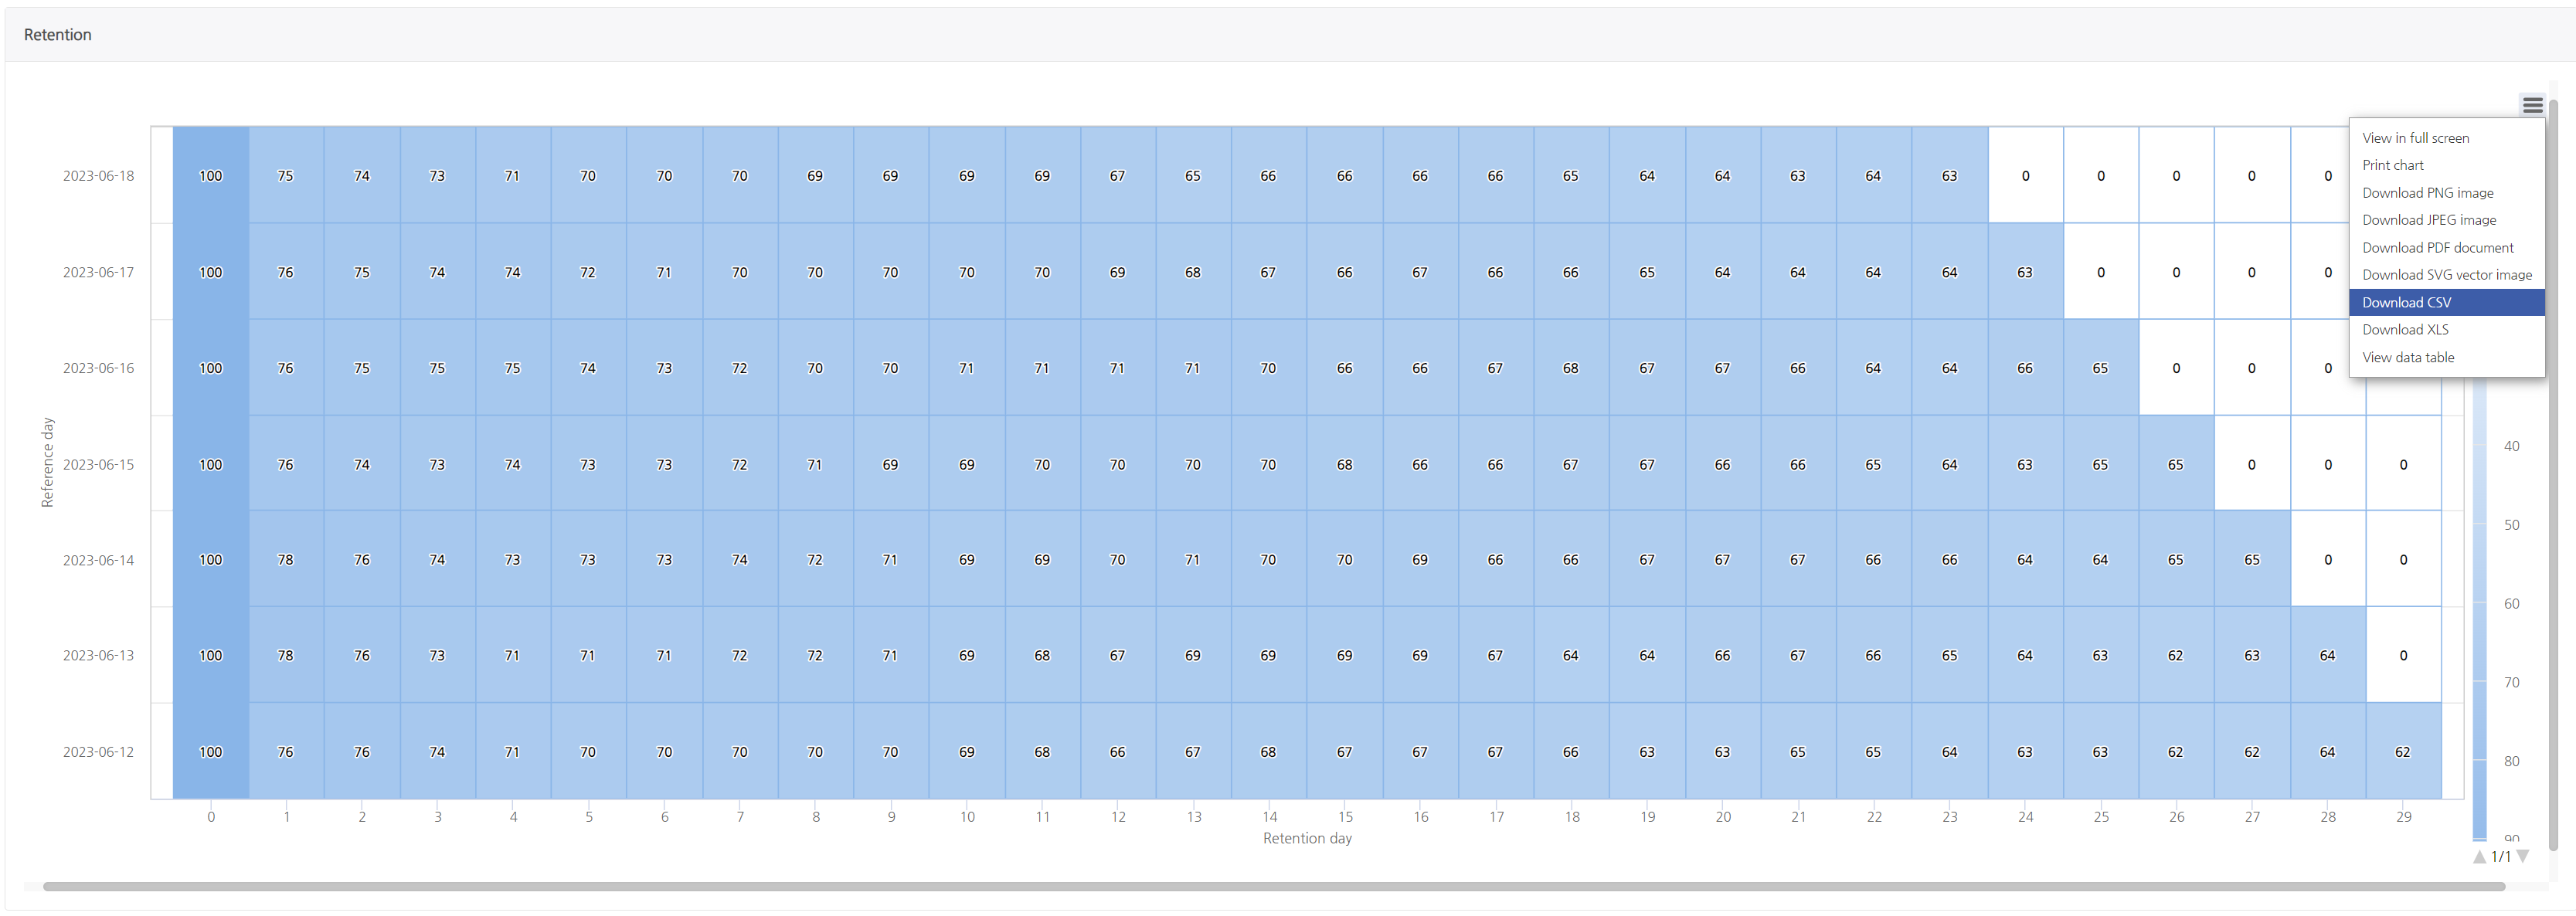
- How to check the retention indicator
- Enter Indicator by Game > User > retention Dashboard and convert the value classification of the indicator to a percentage.
- Check the indicator by setting the indicator query date from the previous week of the week in which the stickiness decreased (month for monthly stickiness) to the current week.
- Check the retention value’s trend of change. (If you need data, you can manually download it as a CSV file by clicking Download CSV.)
- Enter Indicator by Game > User > retention Dashboard and convert the value classification of the indicator to a percentage.
- How to check the retention indicator
- If the influx of NU increases as a result of a game update or marketing action, the ratio of NU to DAU (%) may increase, while the stickiness may decrease. You can also determine whether there were any updates, game events, promotions, etc. during a specific time period.
-
If the stickiness increases
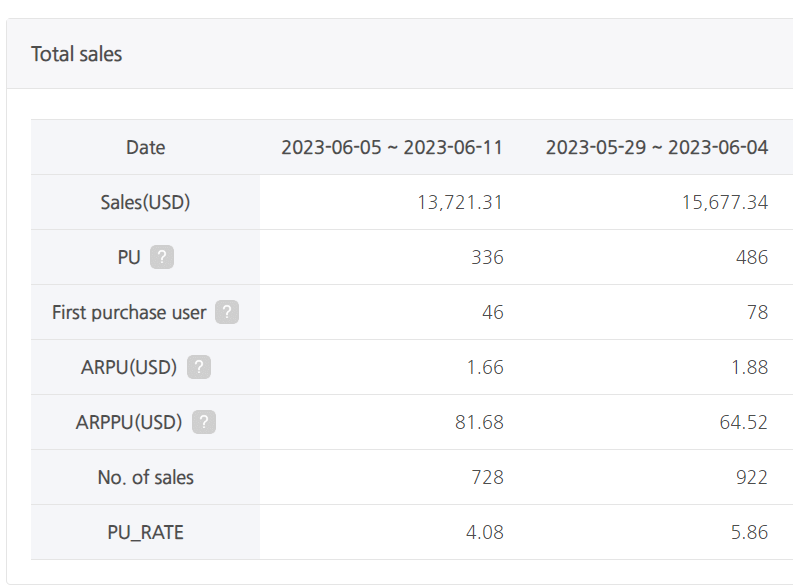
- An increase in the stickiness indicates an increase in game activation. If the stickiness has increased but the ARPPU (amount charged per purchasing user) has not increased, you can consider launching limited-time premium packages and subscription products to increase the ARPPU.
- How to check the ARPPU indicator
- Enter Indicator by Game > Revenue > Revenue Dashboard, choose weekly (Monthly for monthly stickiness), and click Search.
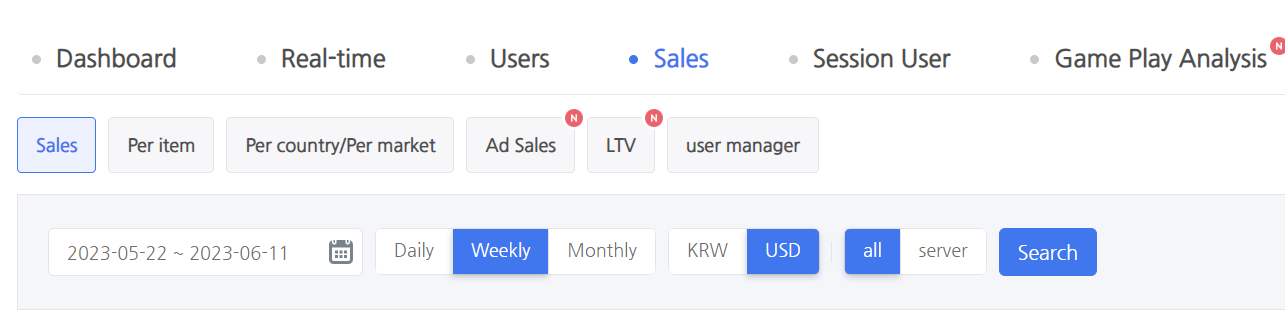
- Check the ARPPU indicator’s exposed change trend across the entire revenue table. (You can directly extract data as a csv file using the data download function.)
- Enter Indicator by Game > Revenue > Revenue Dashboard, choose weekly (Monthly for monthly stickiness), and click Search.
- How to check the ARPPU indicator
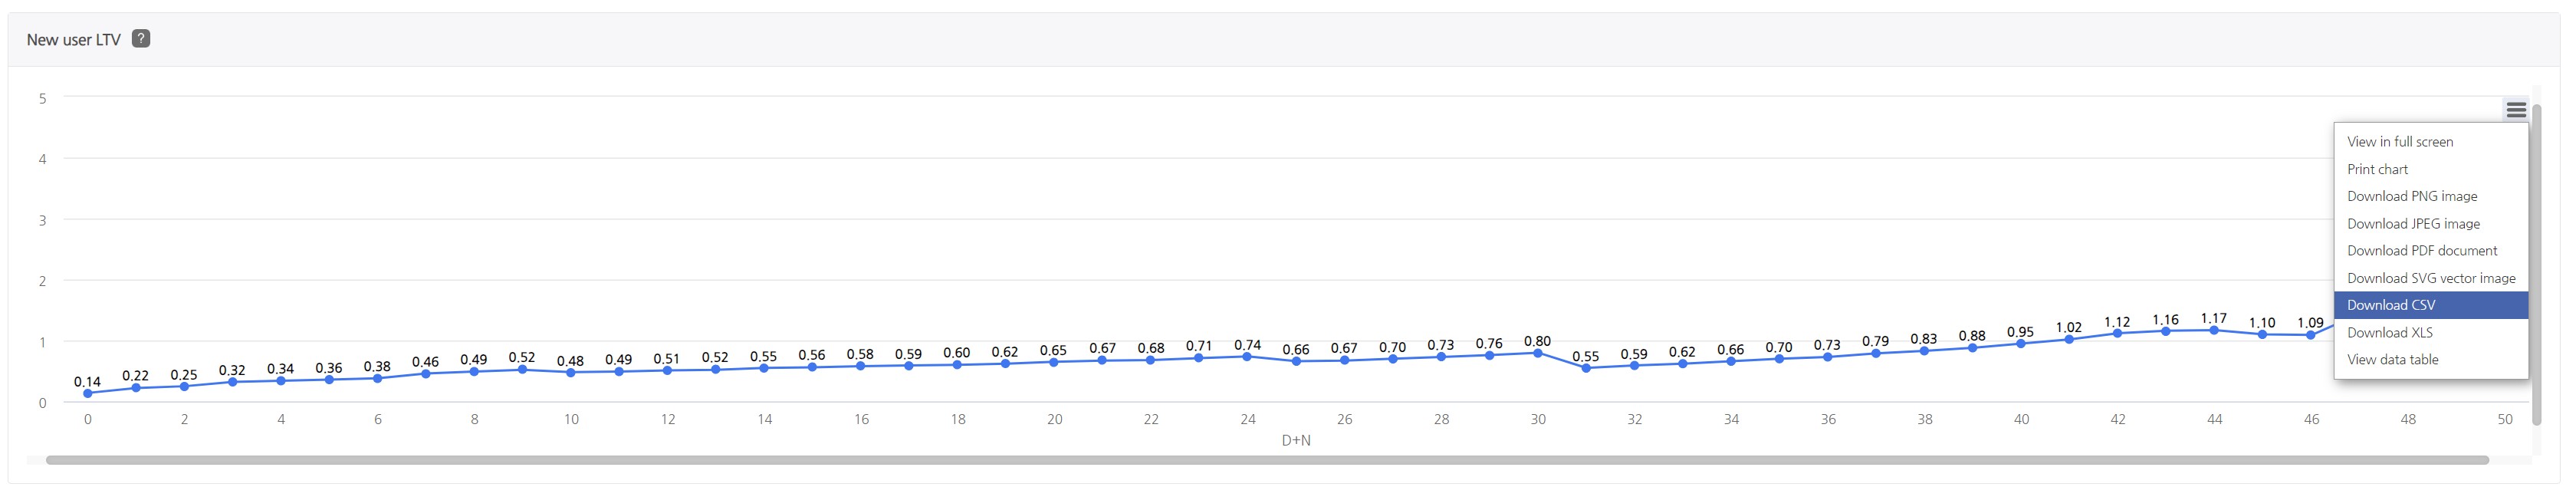
- Games with a high level of stickiness tend to have a higher LTV for new users than games with a low level of stickiness. If the stickiness increases but the new user LTV does not increase simultaneously, you can consider an action plan that encourages gameplay by sending a message to encourage new users to purchase by recommending cost-effective products to new users.
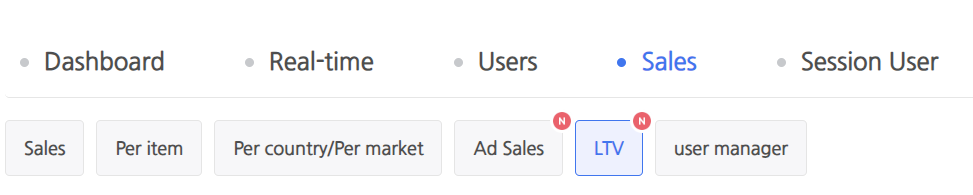
- How to check the LTV indicator
- Enter the Indicator by Game > Revenue > LTV Dashboard.
- Set the indicator query date to the week in which the stickiness increased (month for monthly stickiness) and the week prior to that week to check the indicator.
- Set the indicator query date to Jun. 5th to Jun. 11th and May 29th to Jun. 4th if the stickiness from Jun. 5th to Jun. 11th was lower than the stickiness from May 29th to Jun. 4th.
- Use the value displayed on the new user LTV graph to determine the LTV‘s trend. (If you need data, you can manually download it as a csv file by clicking Download CSV.)
- Enter the Indicator by Game > Revenue > LTV Dashboard.
- How to check the LTV indicator
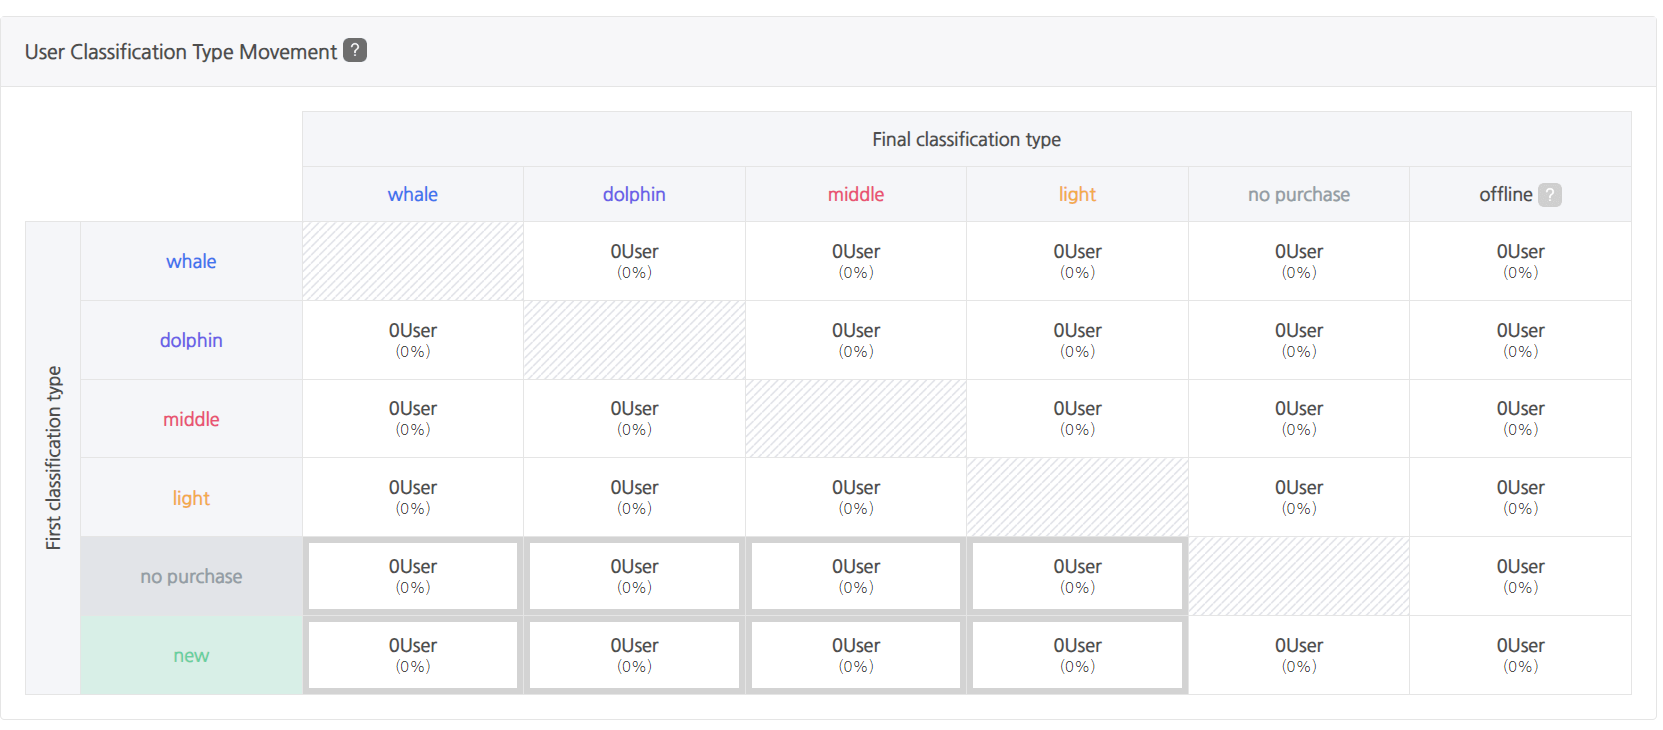
- If the level of game activation increases as a result of an increase in stickiness, it is likely that a greater ratio of users will migrate to higher classification types, such as whales/dolphins. If the trend of change in the ratio of users moving to the higher classification type is the same or decreasing, you can establish a segment targeting users in the lower classification type, such as middle and light, and consider launching a targeted campaign.
- How to check the user classification movement indicator
- Enter the Indicator by Game > User > User Classification Movement Dashboard.

- Set the indicator query date to the week in which the stickiness increased (month for monthly stickiness) and the week prior to that week to check the indicator.
- Set the indicator query date to Jun. 5th to Jun. 11th and May 29th to Jun. 4th if the stickiness from Jun. 5th to Jun. 11th was lower than the stickiness from May 29th to Jun. 4th.
- Check the trend of changes in the number and ratio of users who migrated from subcategory types such as free and new to higher classification types such as whales and dolphins.
- Enter the Indicator by Game > User > User Classification Movement Dashboard.
- How to check the user classification movement indicator
- An increase in the stickiness indicates an increase in game activation. If the stickiness has increased but the ARPPU (amount charged per purchasing user) has not increased, you can consider launching limited-time premium packages and subscription products to increase the ARPPU.
-
In addition to ARPPU, new user LTV, the ratio of NU to DAU, user classification/user classification movement, and retention, there may be other indicators that can be checked concurrently when stickiness increases or decreases, as well as a number of action plans to consider. Check the trend of the game by periodically monitoring the stickiness, which can determine the degree of game activation, and develop an action plan for each situation.