Retention analysis is a feature where you can analyze return rate of users during a certain period of time. Try using the retention analysis to determine when and which users return to the app.
- Backoffice route: Analytics > Retention Analysis
Retention Analysis Screen Guide
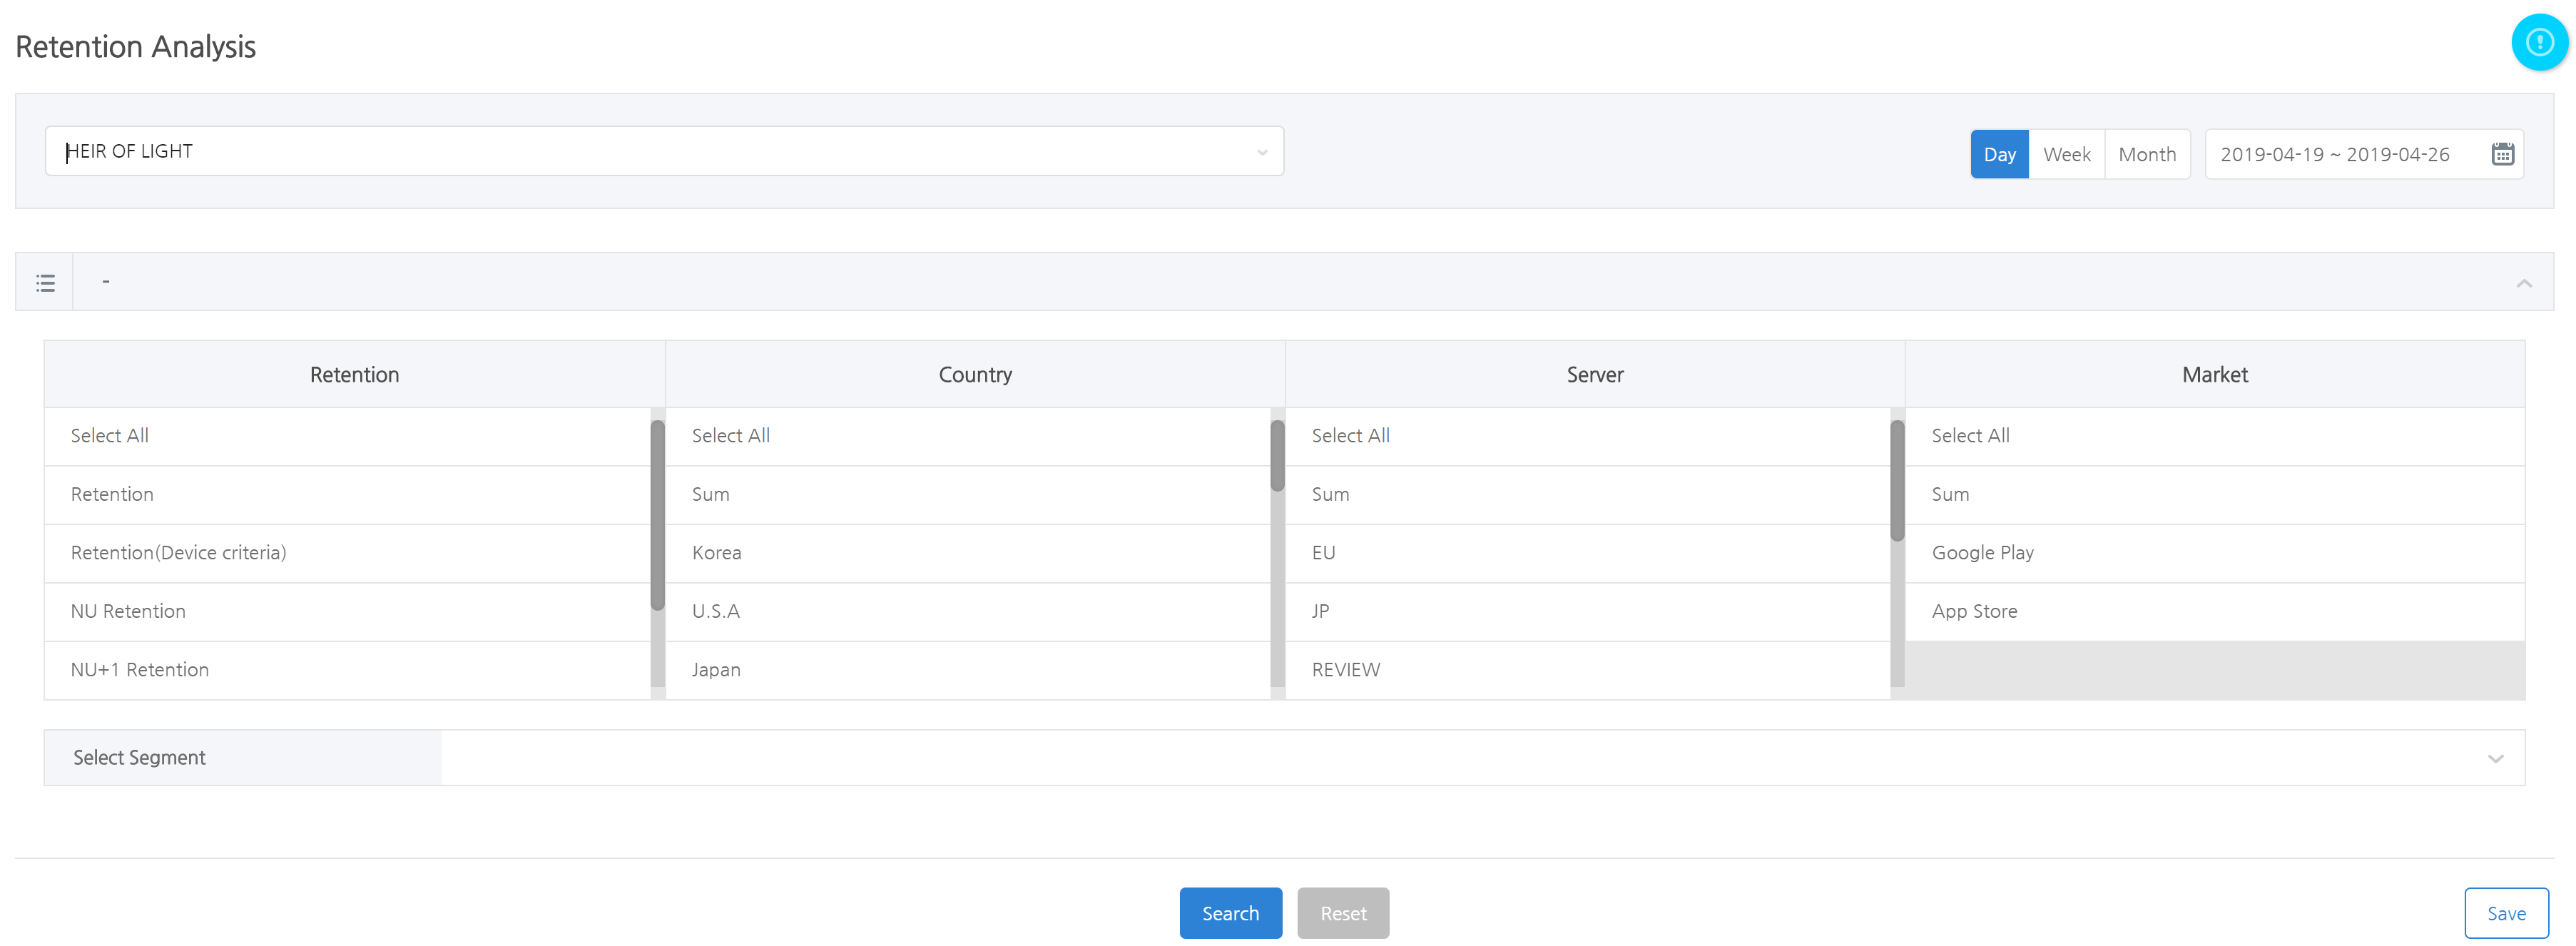
Selecting Date
Set up the date on which to search the index. The date is based on KST(Korea Standard Time).
- Day: Shows results in graphs on a daily basis and you can select up to 90 days.
- Week: Shows results in graphs on a weekly basis and you can select up to 12 weeks. The start date of a week is Sunday and the end date is Saturday. If the start date is not Sunday, it will consider the selected day of the week until Saturday as the first week of the selected period. Likewise, if the end date is not Saturday, it will consider Sunday until the selected day as the last week of the selected period.
- Month: Shows results in graphs on a monthly basis. There’s no limit to the period selection.
Index
The retention index is generated based on the login log collected by Hive.
-
- Data varies by the type of date selected.
- If you select “Day”: Sets the index standard as Daily Active User.
- If you select “Week”: Sets the index standard as Weekly Active User.
- If you select “Month”: Sets the index standard as Monthly Active User.
- Retention: Measures return rate based on users that logged in on the selected date.
- Data varies by the type of date selected.
Retention(Based on devices): Measures return rate based on devices that logged in on the selected date.
- NU Retention: Measures return rate based on new users of the selected date.
- NU+1 Retention: Measures return rate based on new users that logged in for 2 consecutive days on the selected date.
- NU Retention(Based on devices): Measures return rate based on new devices of the selected date.
- NU+1 Retention(Based on devices): Measures return rate based on new devices that logged in for 2 consecutive days on the selected date.
Country/Server/Market
The index value of country, server and market varies by the selected category.
- Country: Selects the country to search for.
- Server: Selects the game server to search for.
- Market: Selects the market to search for. Markets where the game has been launched on will be displayed as a list.
- Bundle Select: Selects all categories.
- Sum: Shows the total value that has not been filtered
Segment
Selecting a segment or snapshot exposes the index based on the data for that user. For more information, go to Operation > Analytics > Segment page.
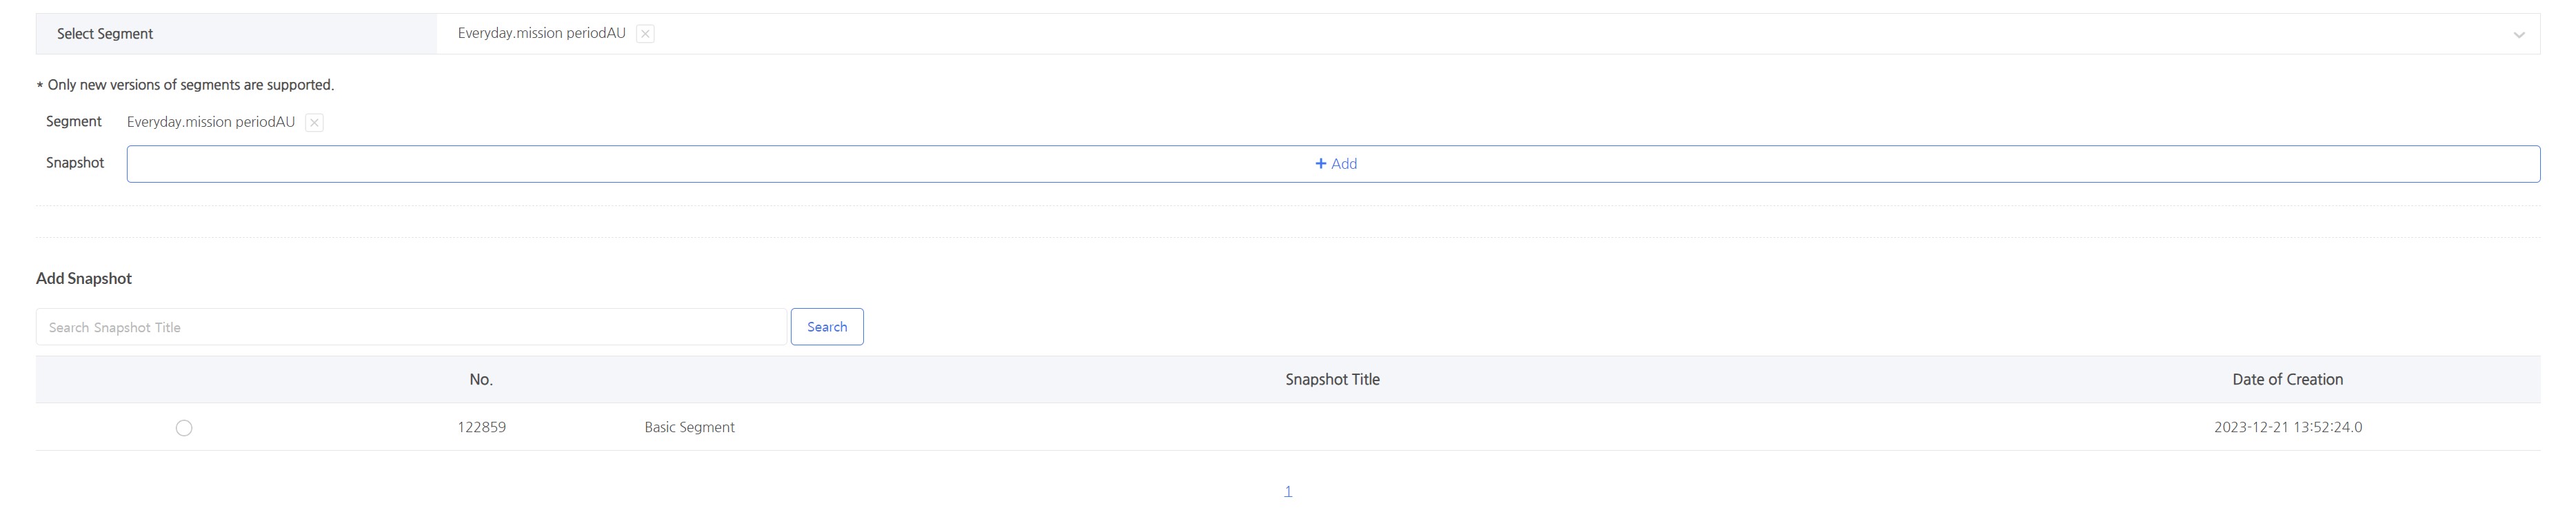
- Steps to select Segment
- Click on the Unfold[∨] button on the segment to show segment and snapshot buttons below.
- Select the segment and snapshot of your choice to expose the data of the corresponding user as index.
- If you search for segment(s) only, it may take longer to show results as the segment’s user extraction and data search are processed in real-time.
Saving Filters
If you save frequently checked indexes as filters, you can load them more quickly without having to set them up every time.
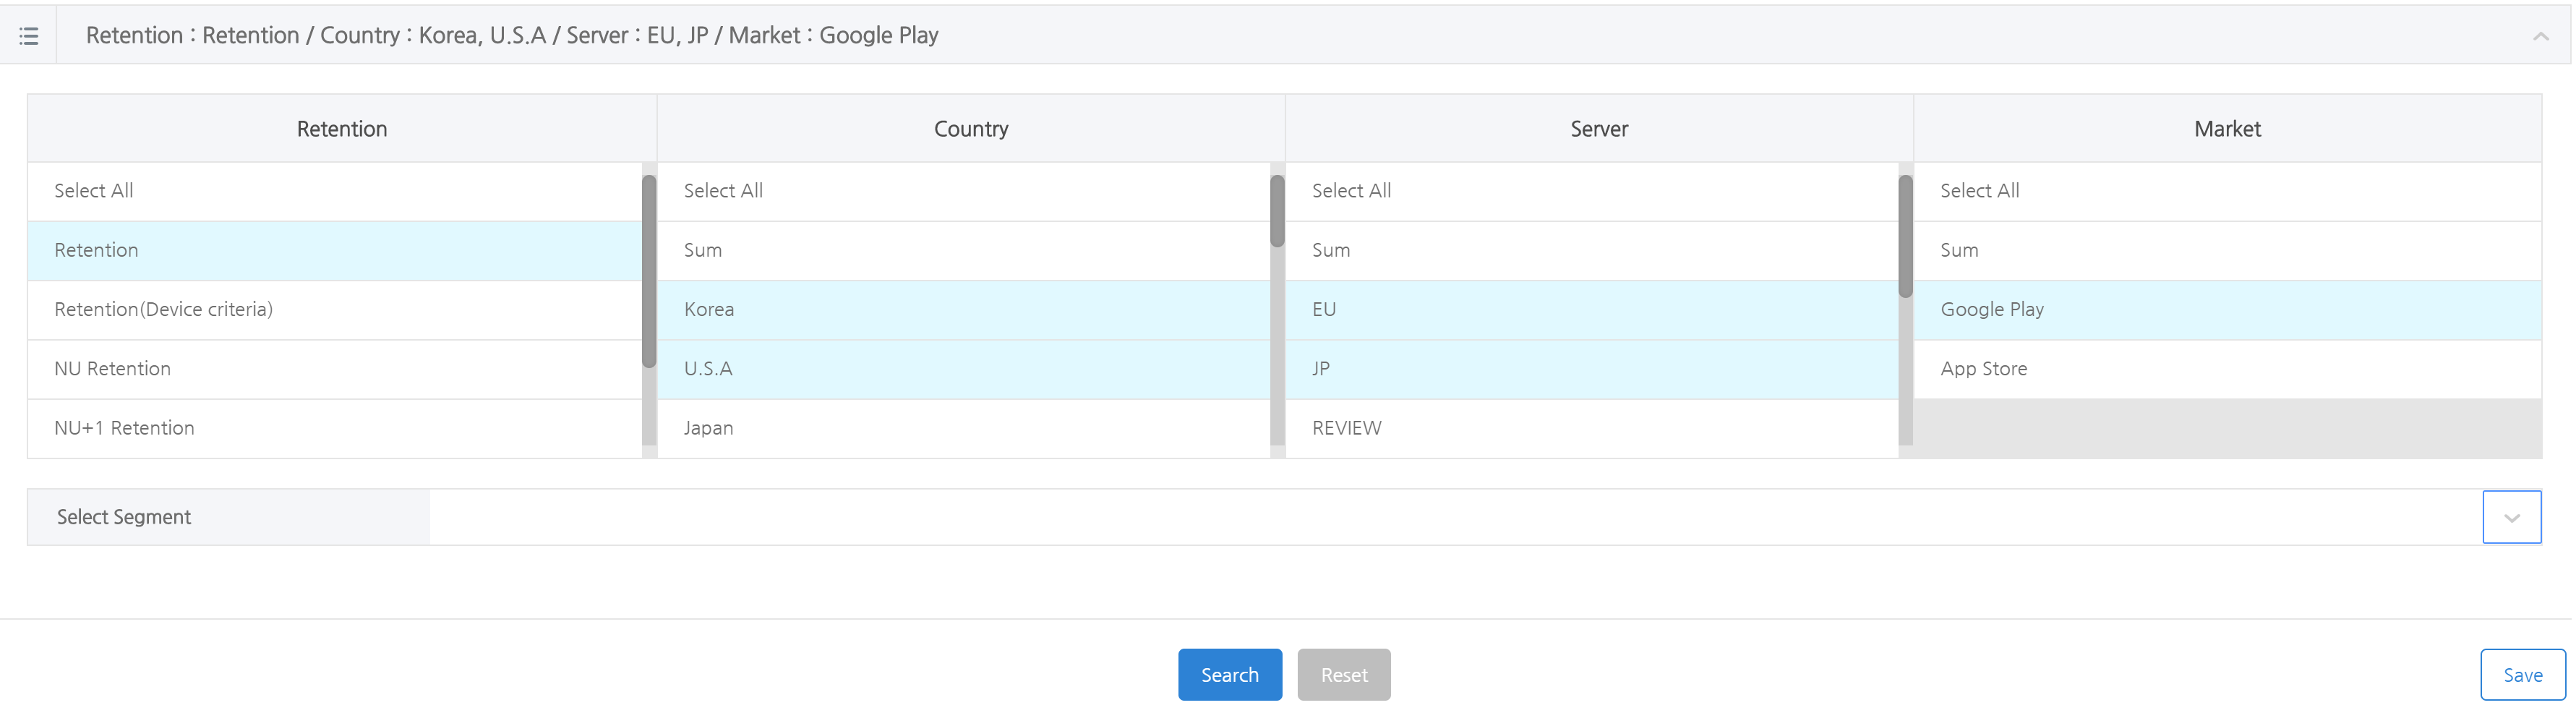
- Select the index, country, server, market and segment you would like to save and click on the Save button. The designated date will NOT be saved.
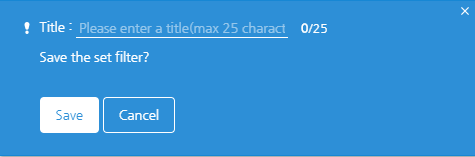
- Click Save to show the pop-up below. Enter the filter title and click Save again.
Loading Filters
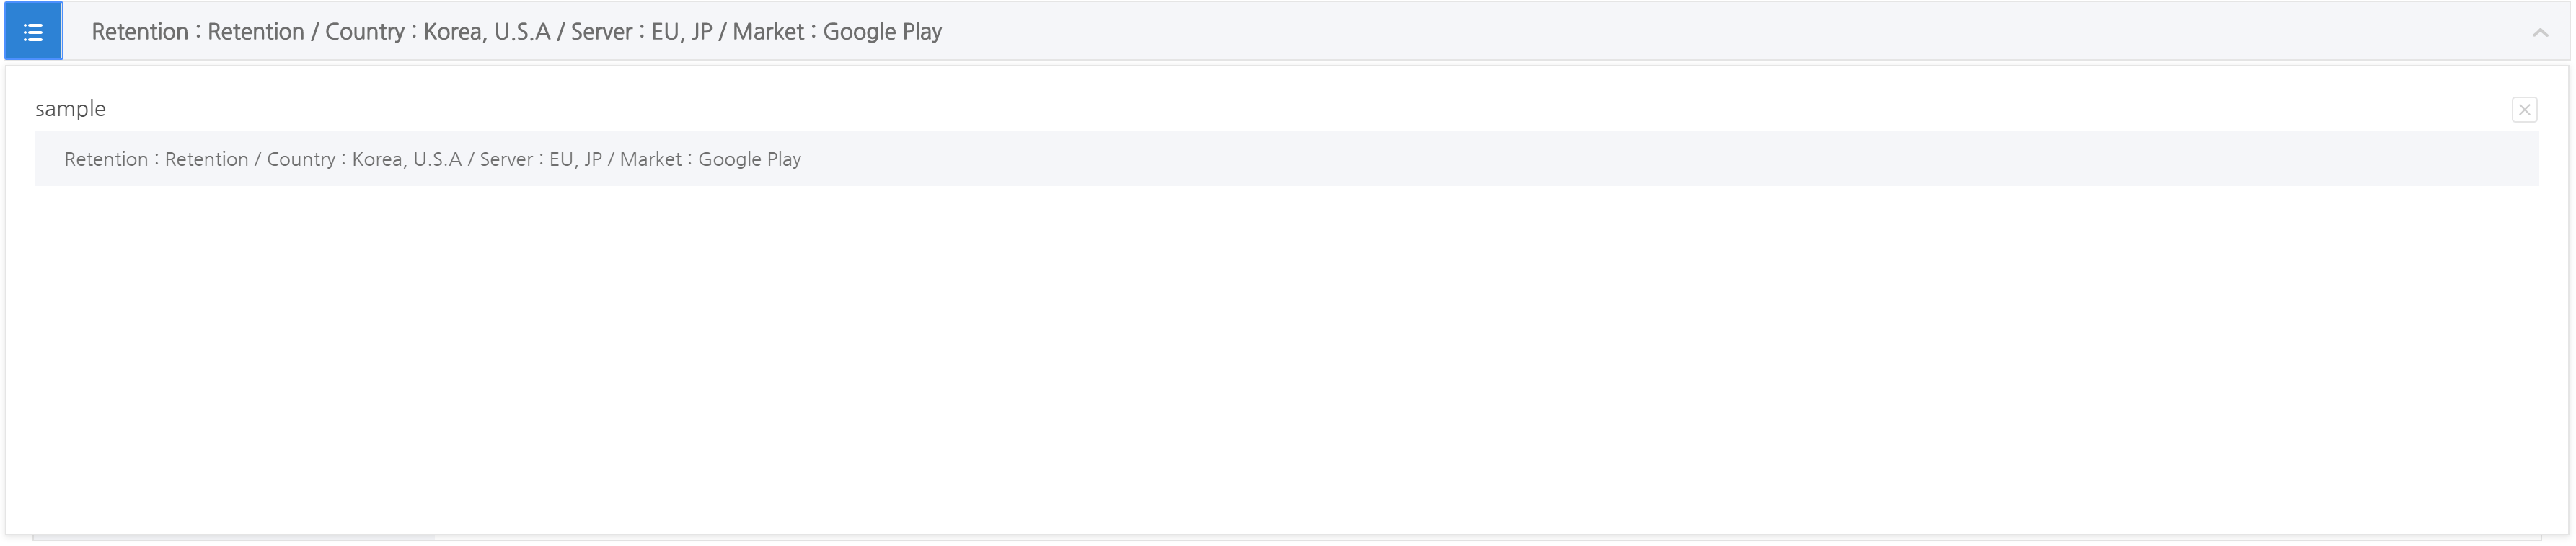
- Click the top-left List(
 ) button on the Filter Settings page to load filters you have saved.
 - Click on the filter title you’ve saved to apply values set for the corresponding filter automatically.
- Click on the X button to delete the filter.