To check advertising performance and indicators, click the Hive Console > Promotion > Cross-promotion Ads > Report menu.
- In the dashboard, you can view key indicators in graphs and easily filter and retrieve the needed data.
- Raw data allows you to download all advertising data collected from a game over a specific period of time.
Select the game and search period for which you want to view statistical data.
Dashboard
Select the game and search period you want to check ad exposure data.
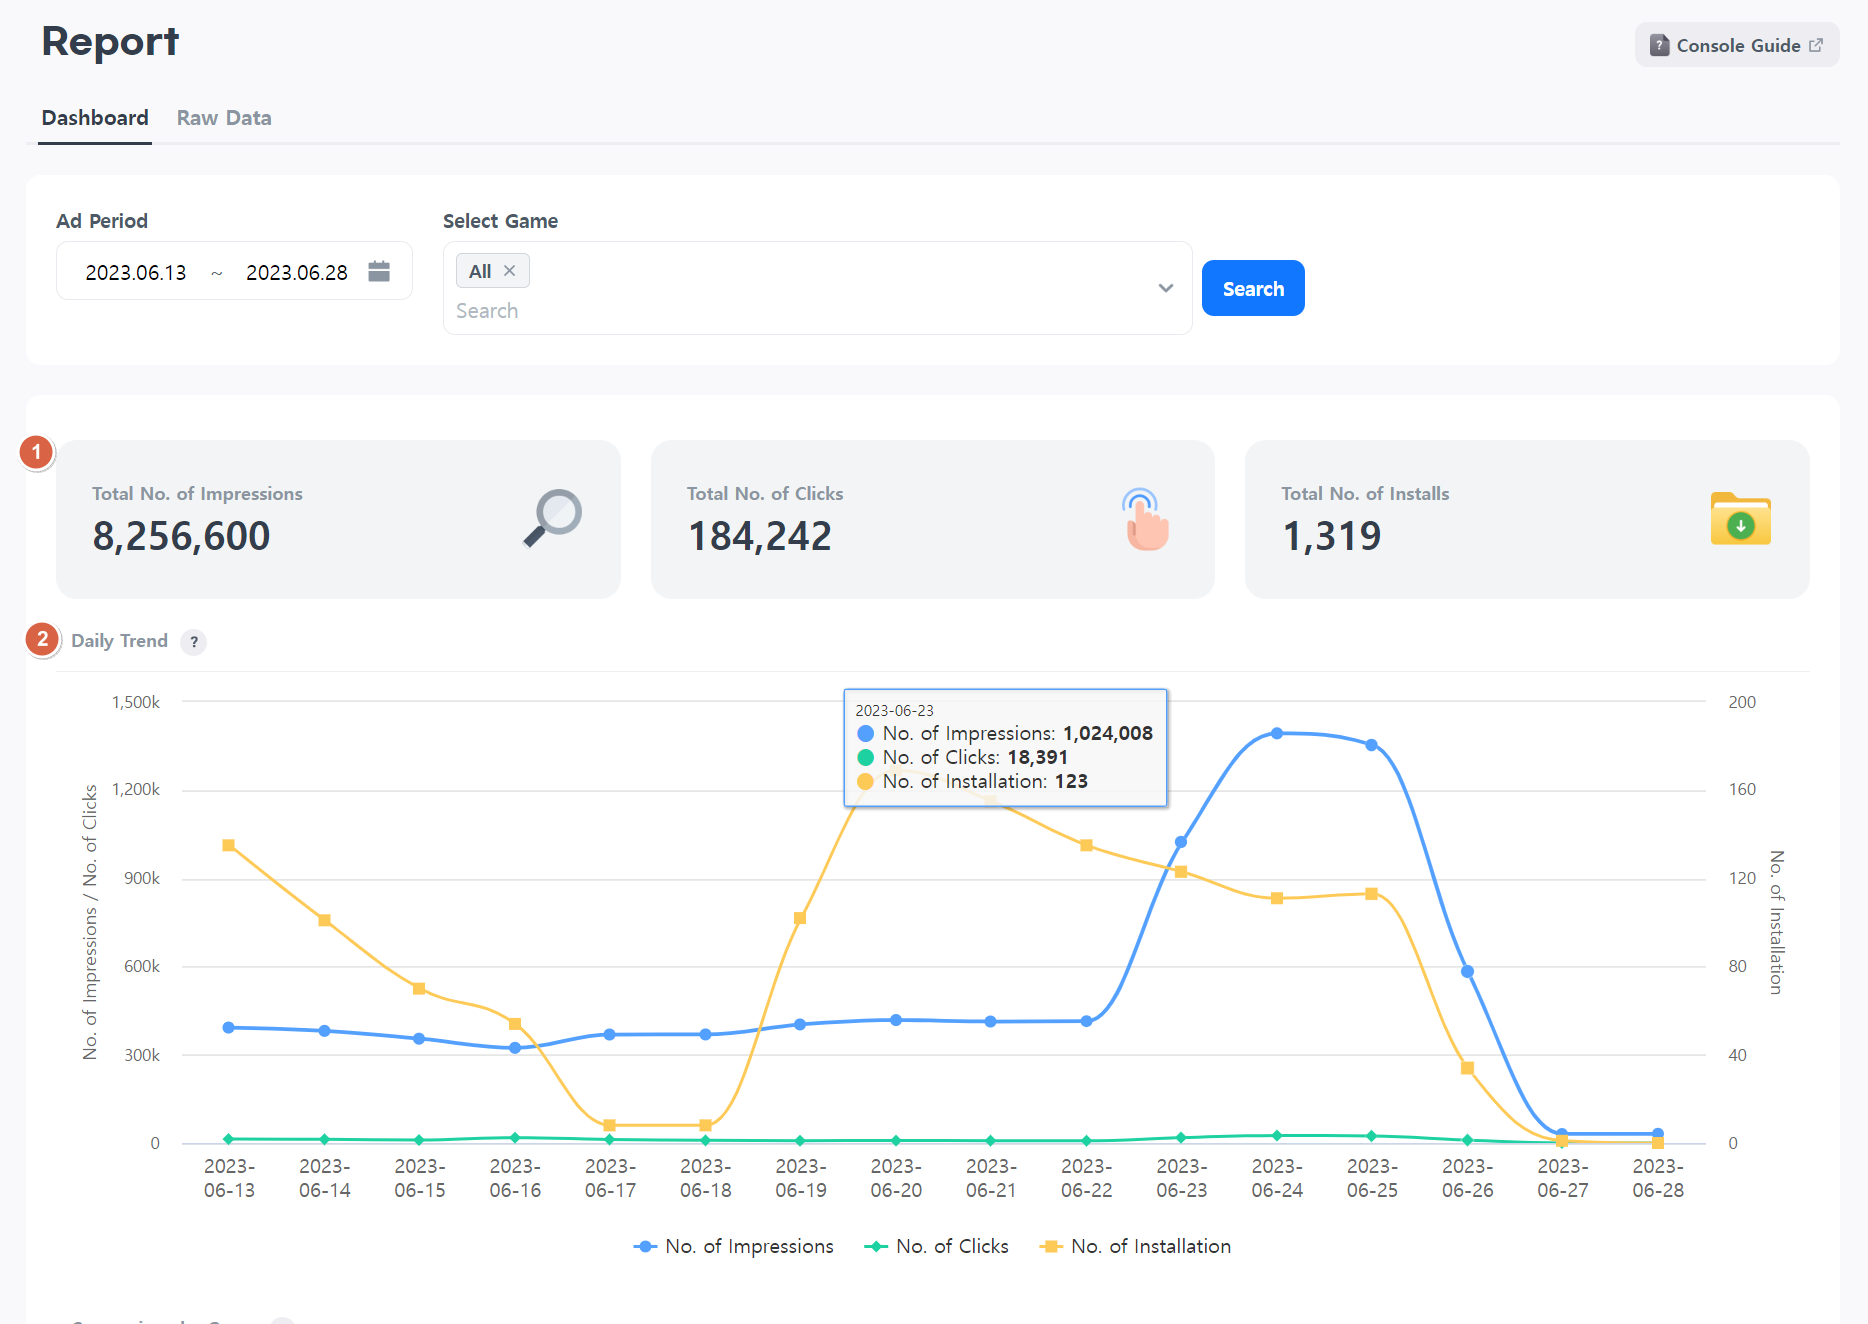
- It displays consolidated values for key indicators (total impressions/total clicks/total installs).
- You can view the daily trends for key indicators in graphs (impressions/clicks/installs).
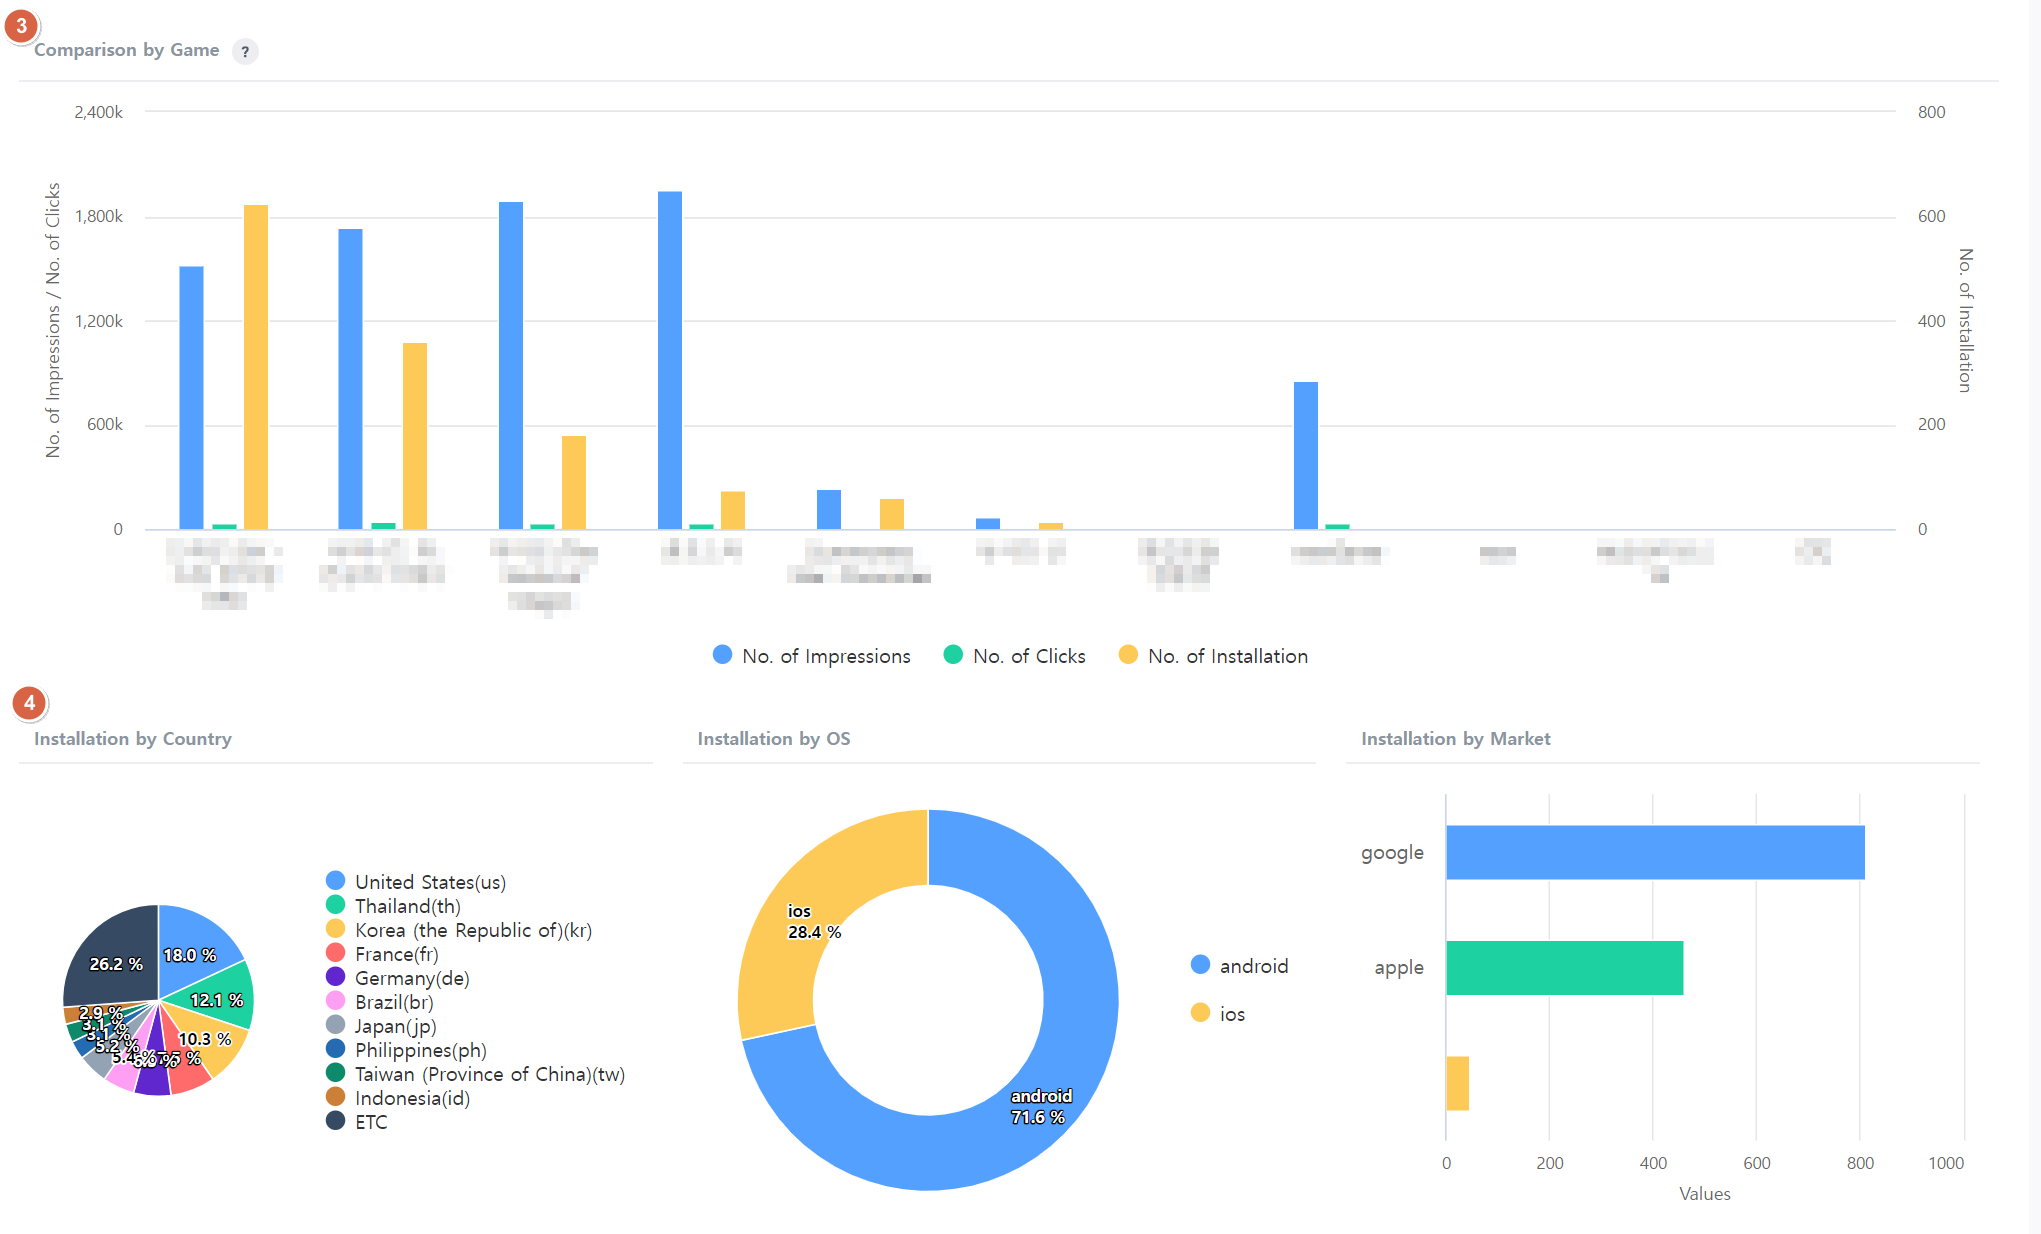
- This is a graph comparing key indicators for each game.
- You can check factors with high installs by country/OS/market in graphs.
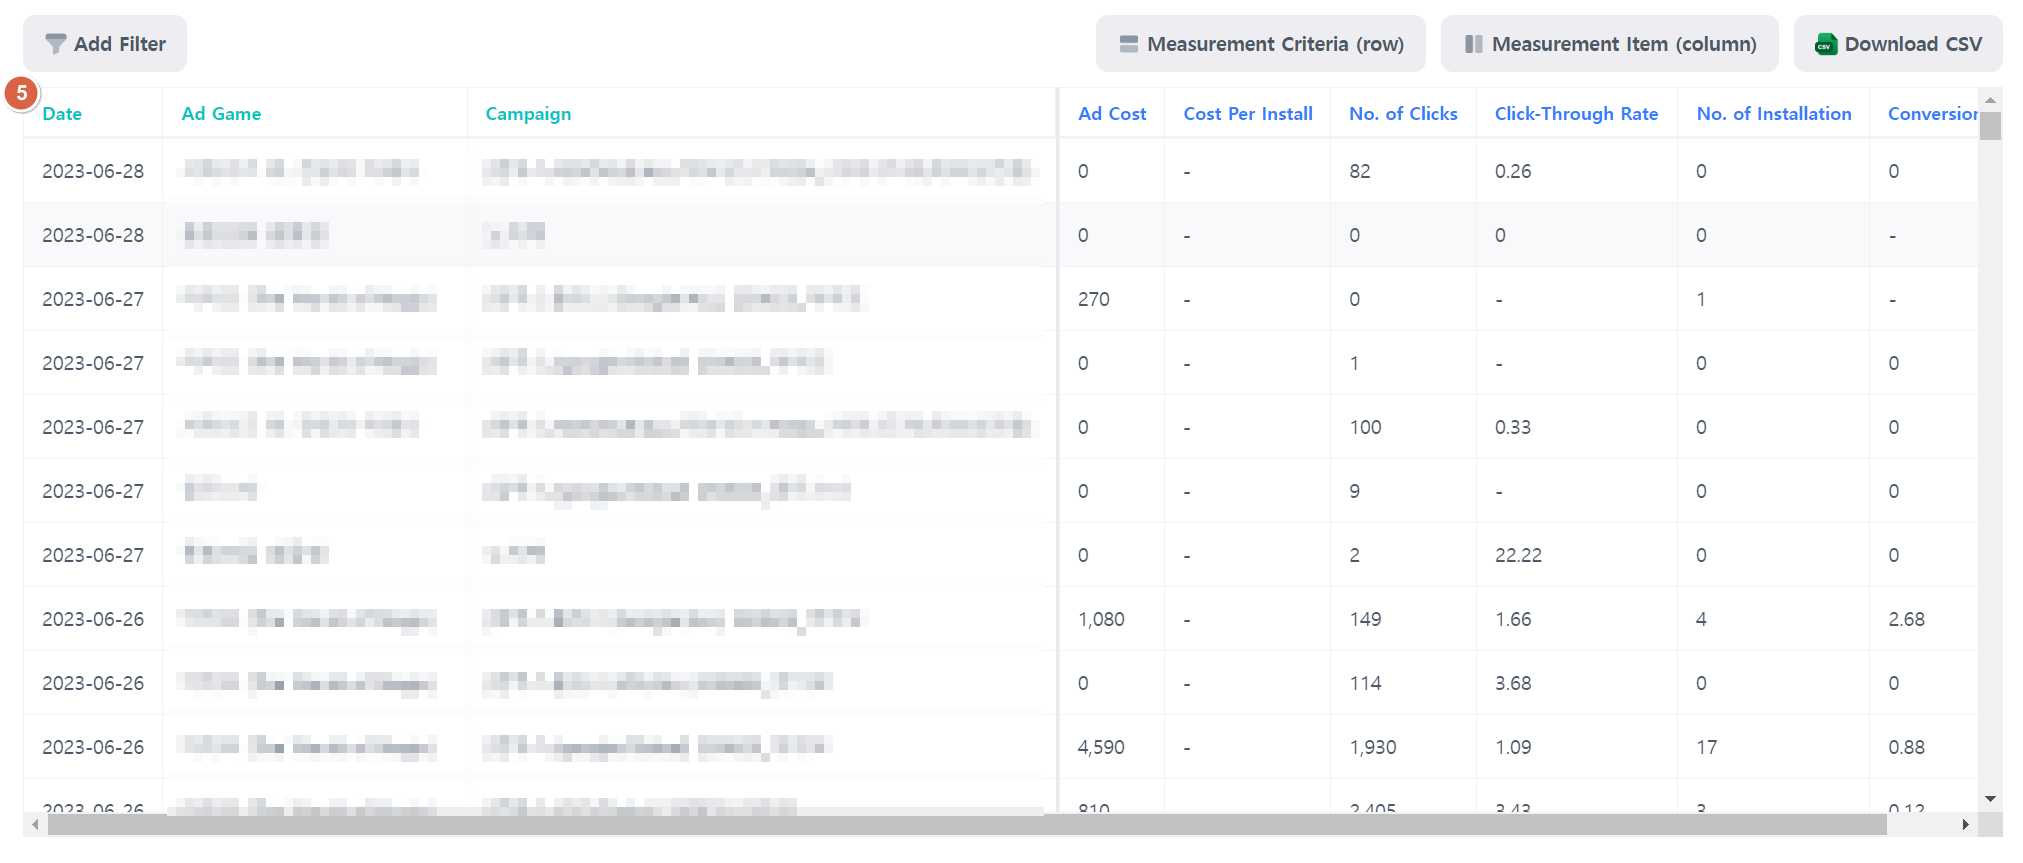
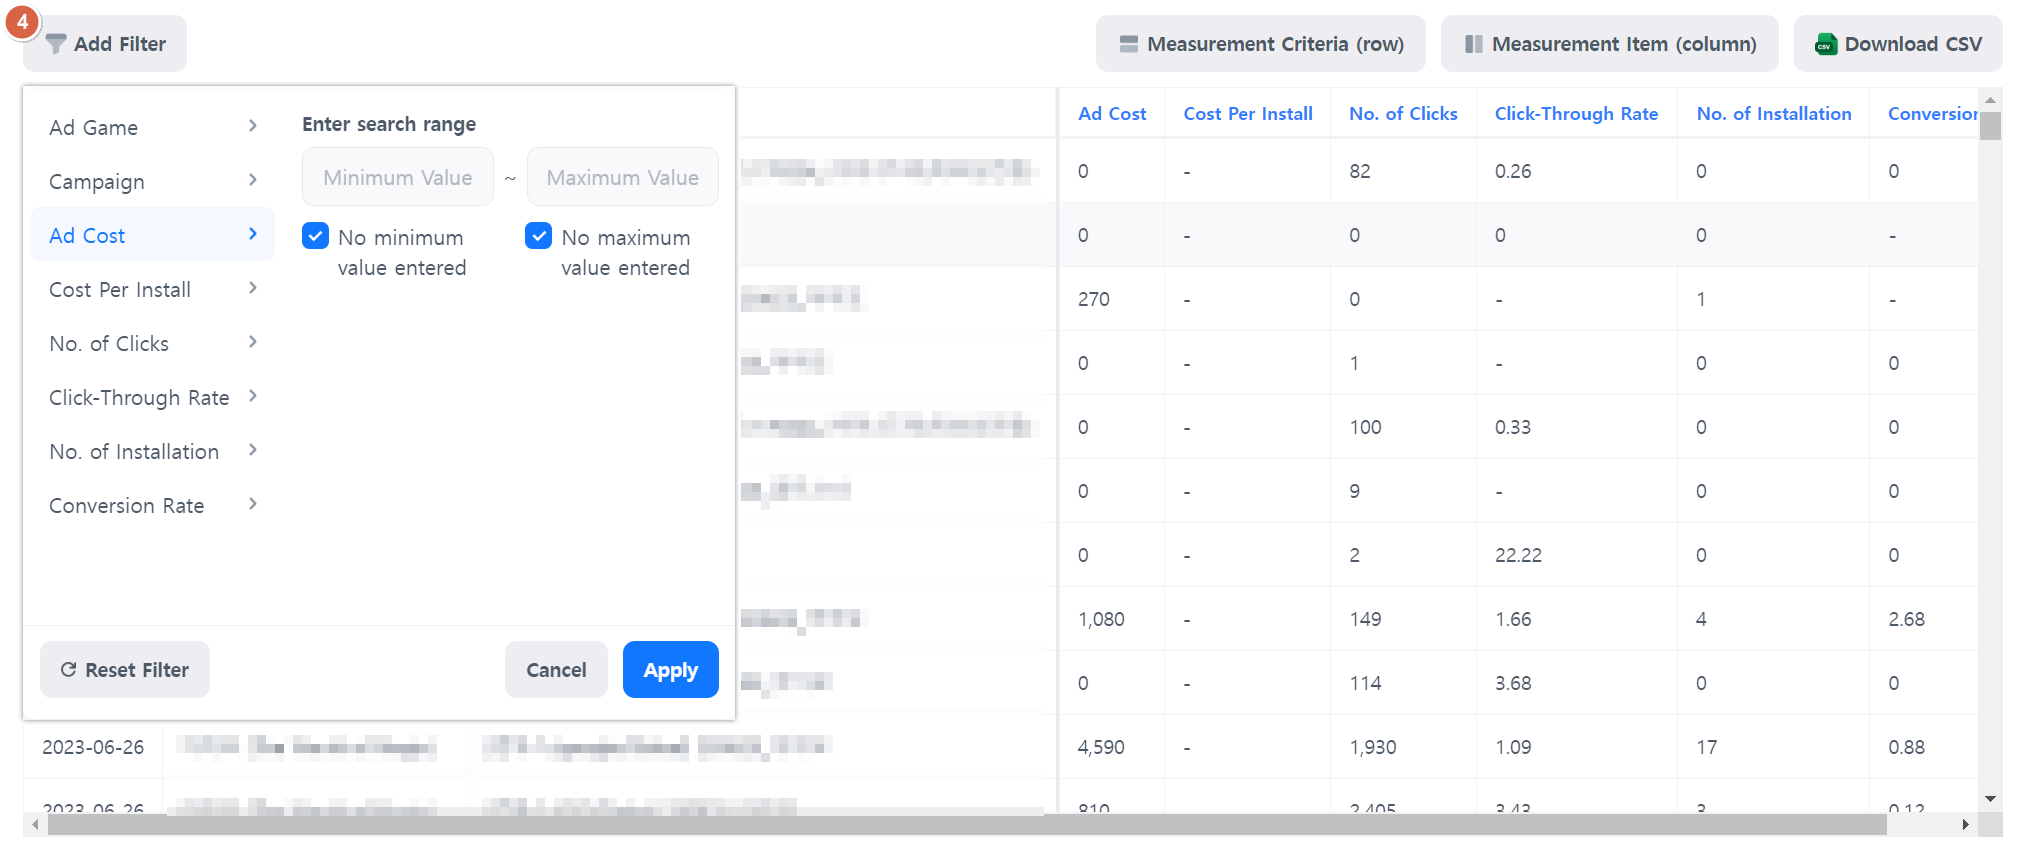
- You can access all advertising data. Set desired search values for each item to check the results.
Extract data
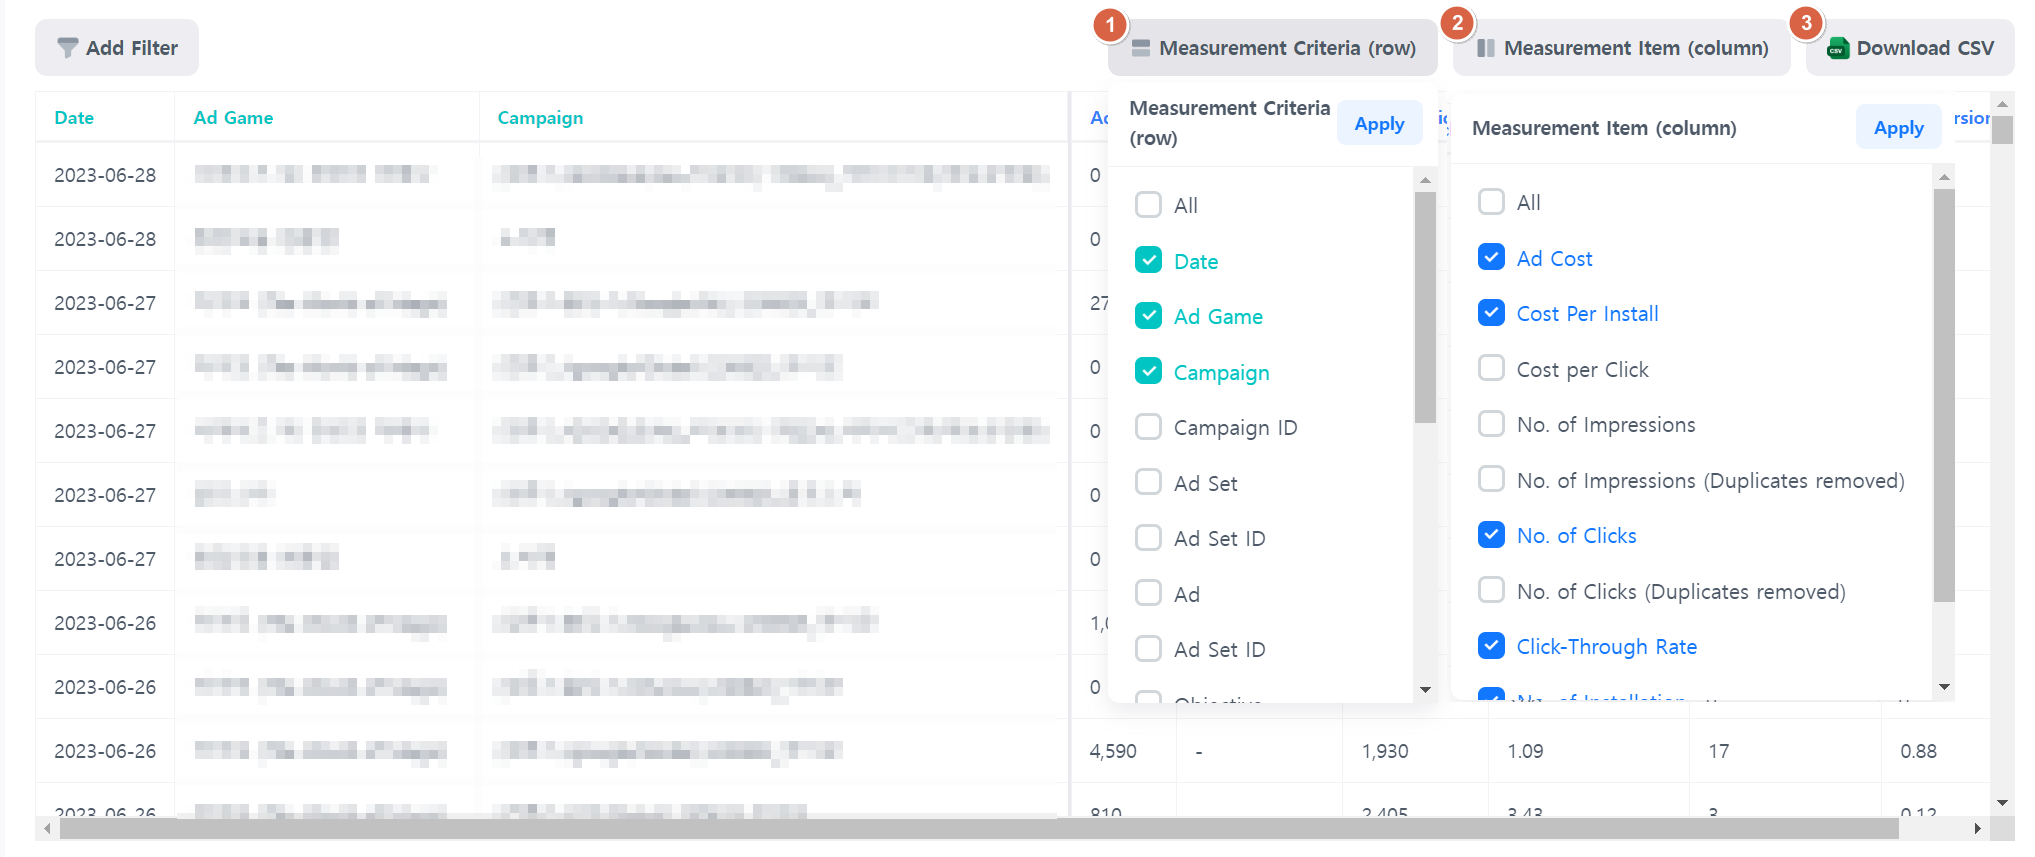
- You can select the items displayed in the rows in the table.
- You can select the items displayed in the columns in the table.
- You can download the currently searched data in a CSV file.
- Apply filters easily on the Report page to extract data.
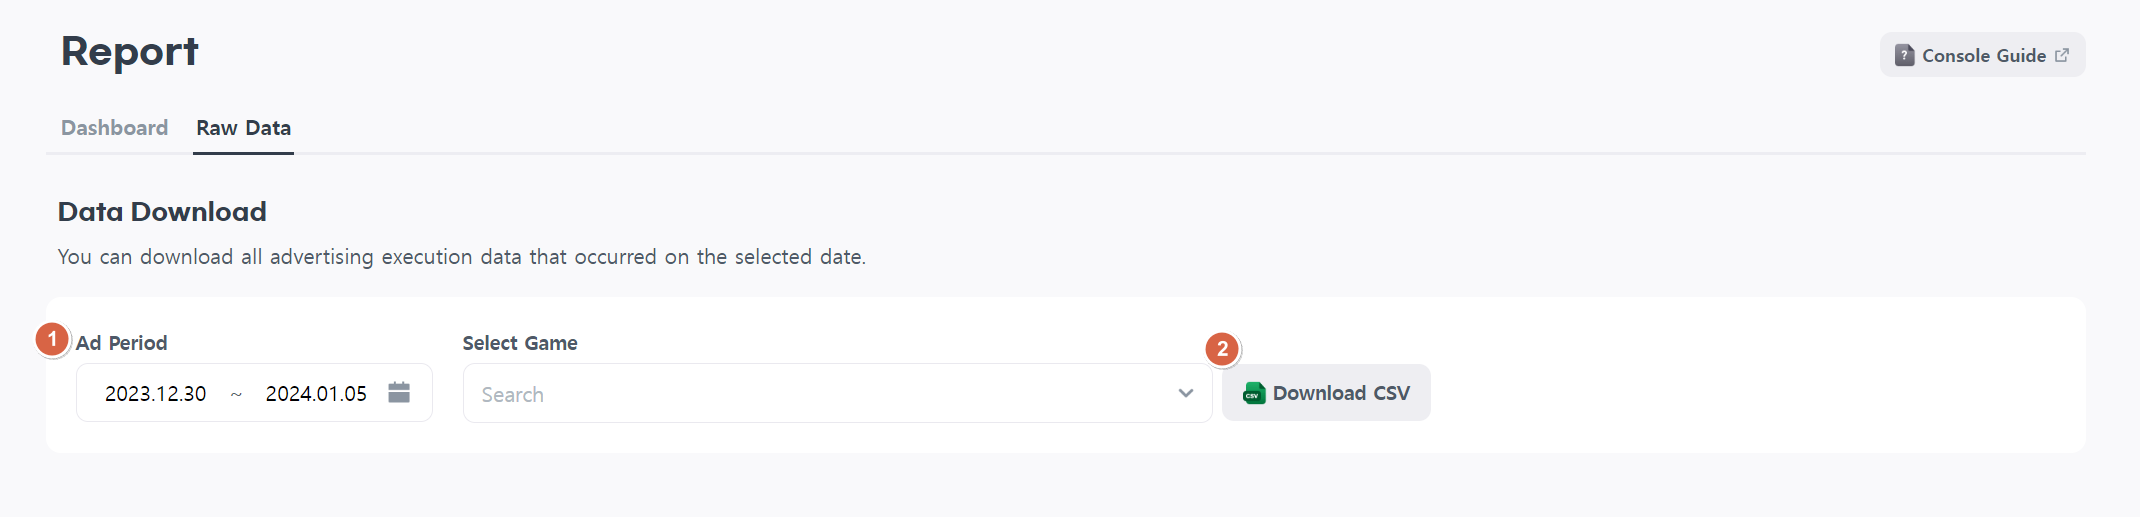
Low Data
-
- Set the game and period for which you want to download data.
- Click the “Data Download” button. All advertising data corresponding to the searched value will be downloaded in a CSV file.