User Classification Movement Indicator
- Based on the user’s in-game activity and purchase-related data, activity and purchasing power are automatically classified through the K-Means clustering technique. User classification types are defined and provided accordingly.
- You can view the user’s usage flow through classification type movement status, based on the user’s first access date and last access date during the selected period.
- This indicator is updated every day at 7:00 AM KST.
- You can view the user classification movement indicator by simply connecting to Hive SDK without having to send separate logs.
Indicator Terms
-
Activity
- User’s activity is measured based on data of the base date (user’s access date), and the three previous days including the base date. For example, if the user made access on January 10th, it will be measured using the data between January 8th and January 10th (3 days).
- Activity consists of 4 stages (High, average, low and new) in total, and the list of measurements are as below. (However, if the activity is “new”, they are a new user on the base date regardless of the measurement items below.)
- Number of logins in the previous 3 days, including the base date
- Number of login days in the previous 3 days, including base date
- Average number of logins per day in the previous 3 days, including the base date (Number of logins / Number of login days)
- Total gameplay time in the previous 3 days, including base date (in seconds)
- Average gameplay time from 12:00 AM – 11:00 PM in the previous 3 days, including base date (in seconds)
- Number of rewarded ads watched in the previous 3 days, including base date
- Push opened in previous 3 days including base date
-
Purchasing Power
- A user’s purchasing power is calculated based on the cumulative data of the user’s first access date to the base date. For example, if the first access date for a user that made access on January 10th is January 1st, it is measured using data from January 1st to January 10th.
- Purchasing power consists of 4 stages (High, average, low and non-purchase) in total, and the list of measurements are as below. (However, if purchasing power is “non-purchase” it means that the user has no purchase history from the first access date – base date, regardless of the measurement items below.)
- Time consumed from user’s first login – first purchase (Unit: Day)
- Number of purchases from user’s first login – base date
- Average amount of charges per purchase from user’s first login – base date (User’s total amount of charges / user’s total number of purchases)
-
User Classification Type
- User classification type is defined based on their activity and purchasing power, and when conditions overlap, they will be classified as higher type.
- Whale user: If both activity and purchasing power are “high”
- Dolphin user: If either one of activity or purchasing power is “high”
- Average user: If either one of activity or purchasing power is “average”
- Light user: If both activity and purchasing power are “low”
- No purchase user: If purchase power is “non-purchase” regardless of the activity
- New user: If activity is “new” regardless of the purchasing power
- User classification type is defined based on their activity and purchasing power, and when conditions overlap, they will be classified as higher type.
Indicator Composition
- Search Condition

- Period selection: You can select the period on a daily basis.
- User Type Remark at the Time of First Classification
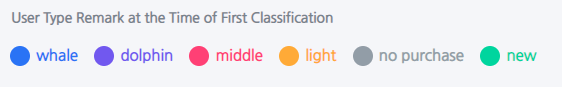
- Color remark based on the first classification result of a user that moved within the selected period.
- When you select a particular classification type, you can highlight the selected type.
- Indicator Description
- User Initial Classification Results
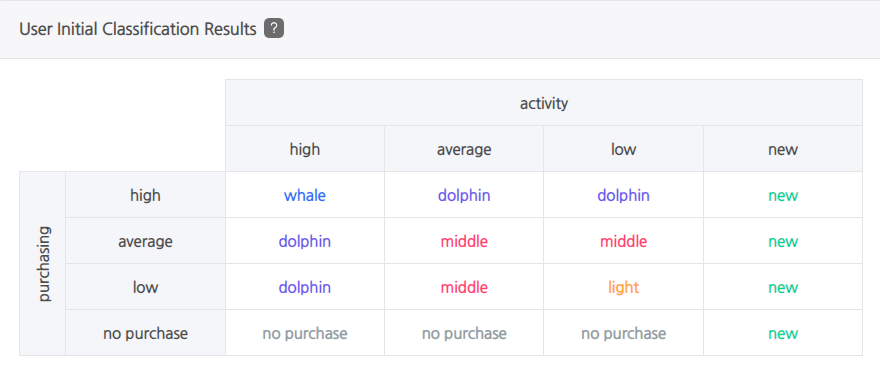
- You can check for the definitions of user classification types based on activity and purchasing power.
- Movement within the User Classification Type

- Targets users with different classification types for the first and last access dates. For example, if the period was selected from January 1st to January 10th and a user that accessed on January 1st, 3rd, 5th and 10th was classified as a Whale user but their classification type changed on January 10th as a Dolphin user, they will be displayed. If they were still classified as a Whale user on January 10th, they will not be displayed.
- You can view the number of users and user percentage that moved from the initial classification type (first access date-based classification type) to the final classification type (last access date-based classification type) during the selected period.
- User number is the number of users who were classified as Type A at the time of initial classification and moved to Type B at the time of final classification.
- User percentage is the percentage calculated from the number of users classified as Type A at the time of initial classification compared to the number of users moved to Type B at the time of final classification. For example, when the period is selected from January 1st to January 10th, if there were 1,000 Whale users on January 1st at the time of initial classification but 100 of them moved to Dolphin users on January 10th at the time of final classification, it will be shown as 100 (10%).
- The offline type of the final classification type is a user who is dormant for 3 or more days, and whose last access is 3 days before the end date of the selected period. For example, if the selected period is from January 1st to January 10th, users whose last access was before January 8th will be classified as offline.
- Classification Movement Status by the Largest User Classification Type

- You can view the classification movement type with the maximum number of users, excluding the types that were finally classified as “No purchase” or “Offline” within the movement table.
- User Distribution before Classification Movement & User Distribution after Classification Movement
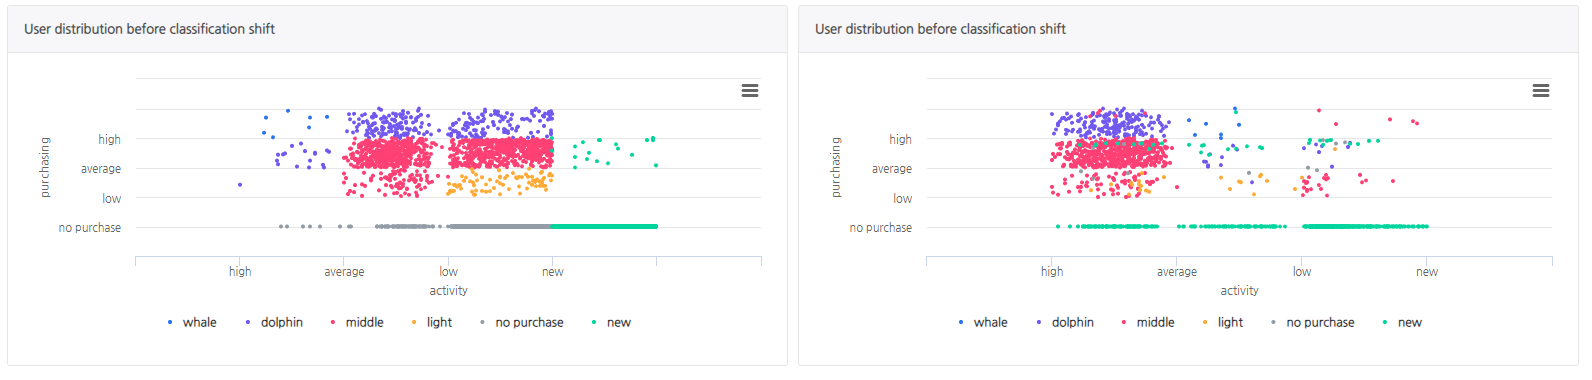
- You can view the movement status of each user’s first to last classification results of a selected period using the colored-coded movement map.
- If a user’s classified movement result is “No purchase” or “Offline (dormant for 3 days or more)” they will be marked in the user distribution graph before the movement, but will not be marked after the distribution movement.
- Each point in the graph represents one user that moved classification during the selected period, and the color of each point is the color of the user classification types from the first classification.
- You can hover the mouse over each user ID (playerId) in the graph to view their classification type at the time of the initial classification and the time of the last classification. Explore various characteristic information of the user using the Hive Analytics BigQuery feature.
- More information on the Hive Analytics BigQuery feature can be found here.
- You can view the movement status of each user’s first to last classification results of a selected period using the colored-coded movement map.
- User Initial Classification Results