User Classification Indicator
- Based on the user’s in-game activity and purchase-related data, activity and purchasing power are automatically classified through the K-Means clustering technique, and based on this, user classification types are defined. The last access date of users accessed during the selected period is set as the base date, and the numbers are provided.
- You can run a targeting campaign for the user types you want to target using the Hive Analytics Segment feature.
- This indicator is updated every day at 7:00 AM KST.
- You can view the user classification index by connecting to Hive SDK without sending additional logs.
Indicator Terms
-
Activity
- User’s activity is measured based on data of the base date (user’s access date), and the three previous days including the base date. For example, if the user made access on January 10th, it will be measured using the data between January 8th and January 10th (3 days).
- Activity consists of 4 stages (High, average, low and new) in total, and the list of measurements are as below. (However, if the activity is “new”, they are a new user on the base date regardless of the measurement items below.)
- Number of logins in the previous 3 days, including the base date
- Number of login days in the previous 3 days, including base date
- Average number of logins per day in the previous 3 days, including the base date (Number of logins / Number of login days)
- Total gameplay time in the previous 3 days, including base date (in seconds)
- Average gameplay time from 12:00 AM – 11:00 PM in the previous 3 days, including base date (in seconds)
- Number of rewarded ads watched in the previous 3 days, including base date
- Push opened in previous 3 days including base date
-
Purchasing Power
- A user’s purchasing power is calculated based on the cumulative data of the user’s first access date to the base date. For example, if the first access date for a user that made access on January 10th is January 1st, it is measured using data from January 1st to January 10th.
- Purchasing power consists of 4 stages (High, average, low and non-purchase) in total, and the list of measurements are as below. (However, if purchasing power is “non-purchase” it means that the user has no purchase history from the first access date – base date, regardless of the measurement items below.)
- Time consumed from user’s first login – first purchase (Unit: Day)
- Number of purchases from user’s first login – base date
- Average amount of charges per purchase from user’s first login – base date (User’s total amount of charges / user’s total number of purchases)
-
User Classification Type
- User classification type is defined based on their activity and purchasing power, and when conditions overlap, they will be classified as higher type.
- Whale user: If both activity and purchasing power are “high”
- Dolphin user: If either one of activity or purchasing power is “high”
- Average user: If either one of activity or purchasing power is “average”
- Light user: If both activity and purchasing power are “low”
- No purchase user: If purchase power is “non-purchase” regardless of the activity
- New user: If activity is “new” regardless of the purchasing power
- User classification type is defined based on their activity and purchasing power, and when conditions overlap, they will be classified as higher type.
Indicator Composition
- Search Condition
- Period selection: You can select the period on a daily basis.
- User Classification Type Remark
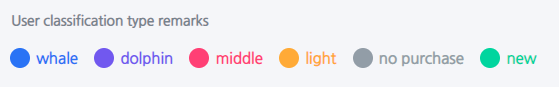
- Remark for the color of each user classification type.
- You can target users of the selected type by clicking on a certain classification type.
- Creating a Segment

- By clicking on the Create Segment button after selecting a cell in two tables within user classification type remark and user classification type, you can target the selected user and also create segments.
- Indicator Description
- The numbers in the indicator provides figures based on the last access date of a user during the selected time period. For example, if the period is selected from January 1st to January 10th, users who accessed on January 1st, 3rd, 5th, and 10th will be based on January 10th, and users who accessed only January 1st will be based on January 1st.
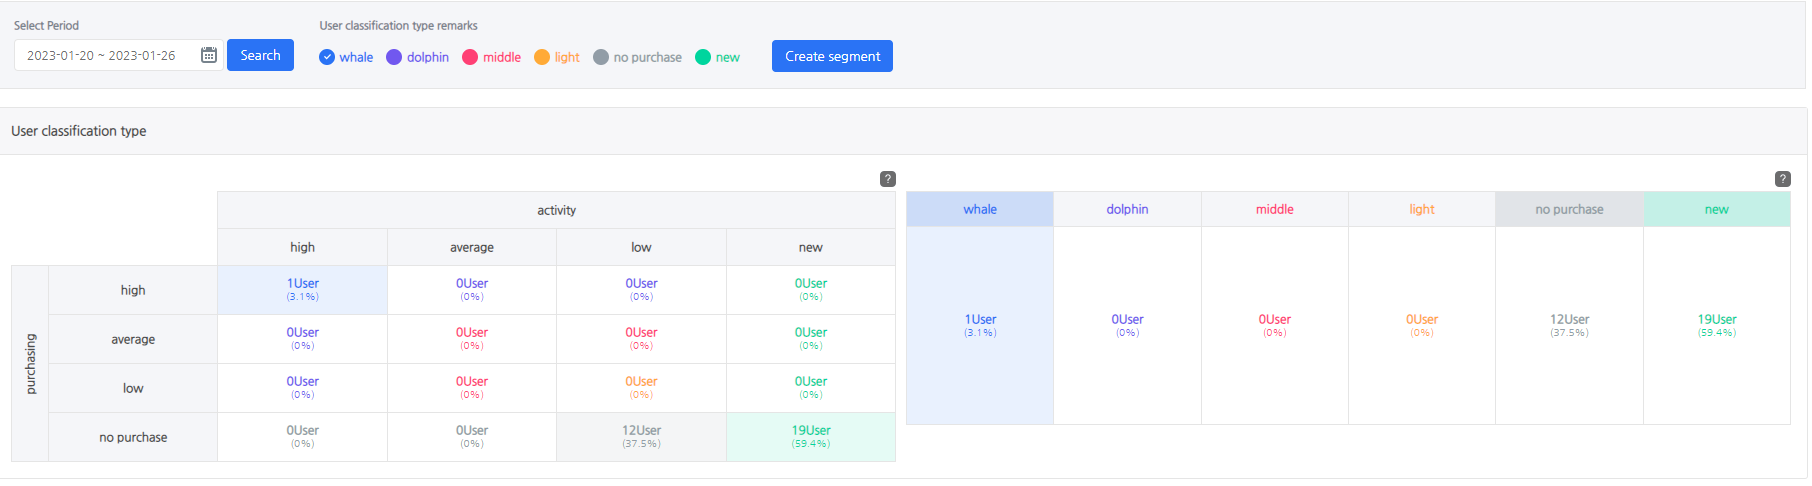
- User Classification Type
- You can check the number and percentage of users by activity/purchasing power through the left table within the user classification type, and the number and percentage by user classification type through the right table.
- The following is an explanation on the provided table.
- User Number and percentage by Activity/Purchasing power
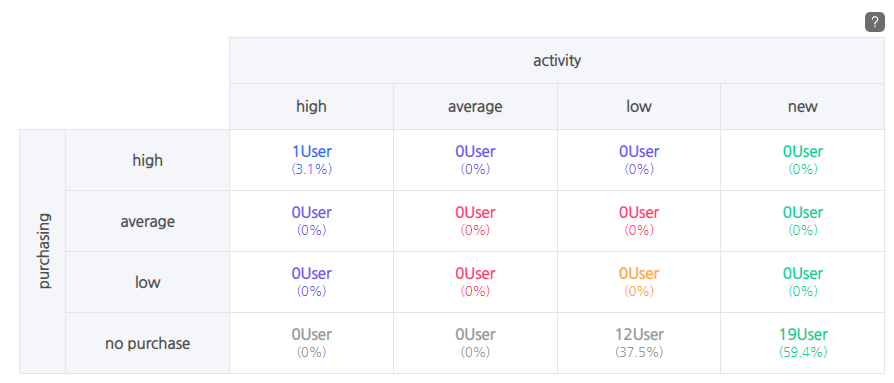
- You can view the number of users and percentage by activity/purchasing power.
- When clicking on the cell on the table, segments are created with users that have activity/purchasing power.
- User Number and Percentage by User Classification Type
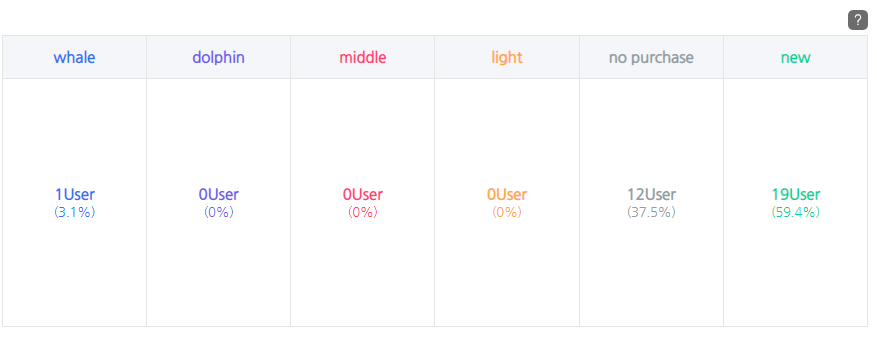
- You can view the number and percentage by user classification type.
- You can create segments of the users with classification type you want to target by clicking on the type name or the cell of the table.
- The sum of the user classification types in the table is 100%, and if you click on all the classification types, you can target all users within the selected time period.
- User Number and percentage by Activity/Purchasing power
- Characteristic Distribution by User Classification Type

- You can view the distribution of the characteristic values for each user classification type.
- Following is the description for each characteristic provided:
- Playtime (min/avg.): Average playtime in minutes on the day of the last access within the selected time period by user classification type.
- Login days (avg.): Average number of login days in the previous three days, including the last access in the selected time period by user classification type.
- Number of logins (avg.): Average number of logins in the previous three days, including the last access in the selected time period by user classification type.
- Average number of logins per day: Average value calculated by the number of login days/logins by user classification type.
- Push response rate (avg.): The percentage of the push opened in the previous three days, including the last access in the selected time period by user classification type.
- Rewarded ad views (avg.): Number of rewarded ads watched in the previous three days, including the last access in the selected time period by user classification type.
- Days elapsed until first purchase (avg.): Average number of days from the first access to the first purchase by user classification type.
- Total billing amount : Sum of billing amount from the first access date of the user to the last access date within the selected period for each user classification type.
- Billed amount per user : Average billing amount (cumulative billing amount / the number of paying users) per user with at least one purchase history from their first access until their last access within the selected period.
- OS Distribution by User Classification Type

- You can view the percentage of each OS by user classification type.
- I: Stands for IOS.
- A: Stands for Android.
- W: Stands for Windows.
- M: Stands for Mac.
- P: Stands for PC.
- B: Stands for Alibaba’s Yun OS.
- T: Stands for Tizen.
- If the OS shows up as “Unknown“, it is when the Hive login log does not contain any OS values, or when none of the users belong to the user classification type.
- You can view the percentage of each OS by user classification type.
- Top 10 Countries by User Classification Type
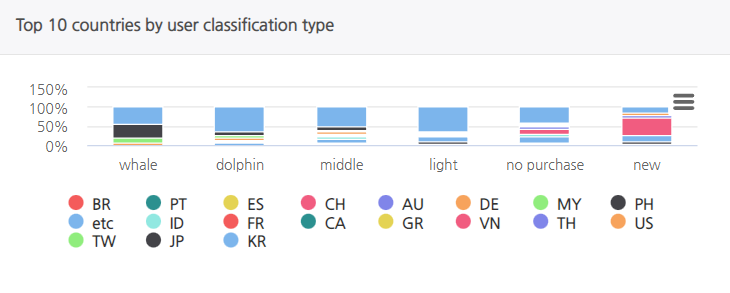
- By hovering the mouse over each graph, you can view the country code and percentage for the top 10 countries by user classification type, and the percentage for values other than the top 10 countries by etc.
- Country code is based on ISO 3166-1 alpha-2 (2 byte country code), and consists of 2 upper-case letters.
- If the country code is unknown, it means that the Hive login log does not contain the country value, or no users belong to that type of user classification.
- By hovering the mouse over each graph, you can view the country code and percentage for the top 10 countries by user classification type, and the percentage for values other than the top 10 countries by etc.
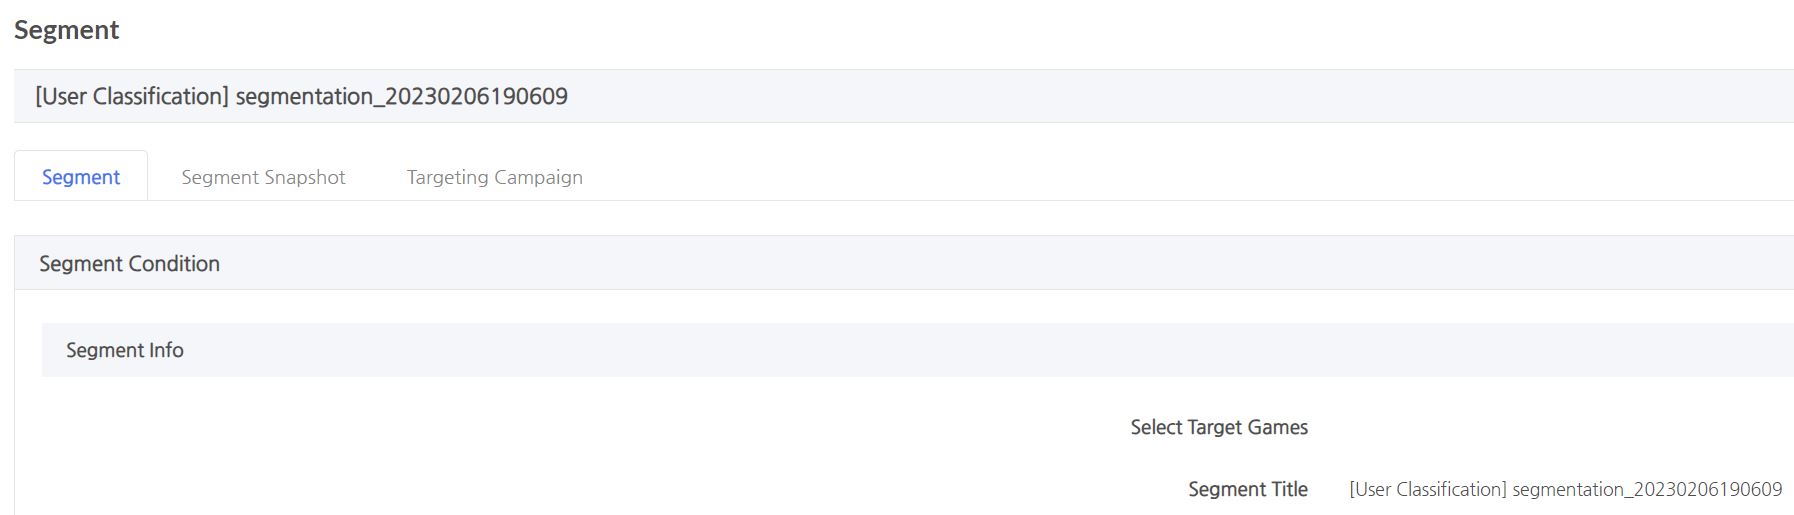
Creating a Segment
- You can create segments by clicking on cells within two tables of user classification types and clicking the Create Segment button. You can utilize the generated segments as follows:
- You can download the feature data of selected users in CSV files using Hive Analytics Segment > Segment Snapshot > Download function.
- You can set Targeting Campaigns for the users using Hive Analytics Segment > Targeting Campaign function.
- Click here to find more details about Hive Analytics Segment and Click here to find more details about Hive Analytics Targeting Campaign.
- How to Create a Segment
- Between User Classification Type Remark and User Classification Type table, click on one or more cells that you want to target.
- Click on “Create Segment” button and check for the pop-up to create the segment. When the pop-up comes up, click “OK”.
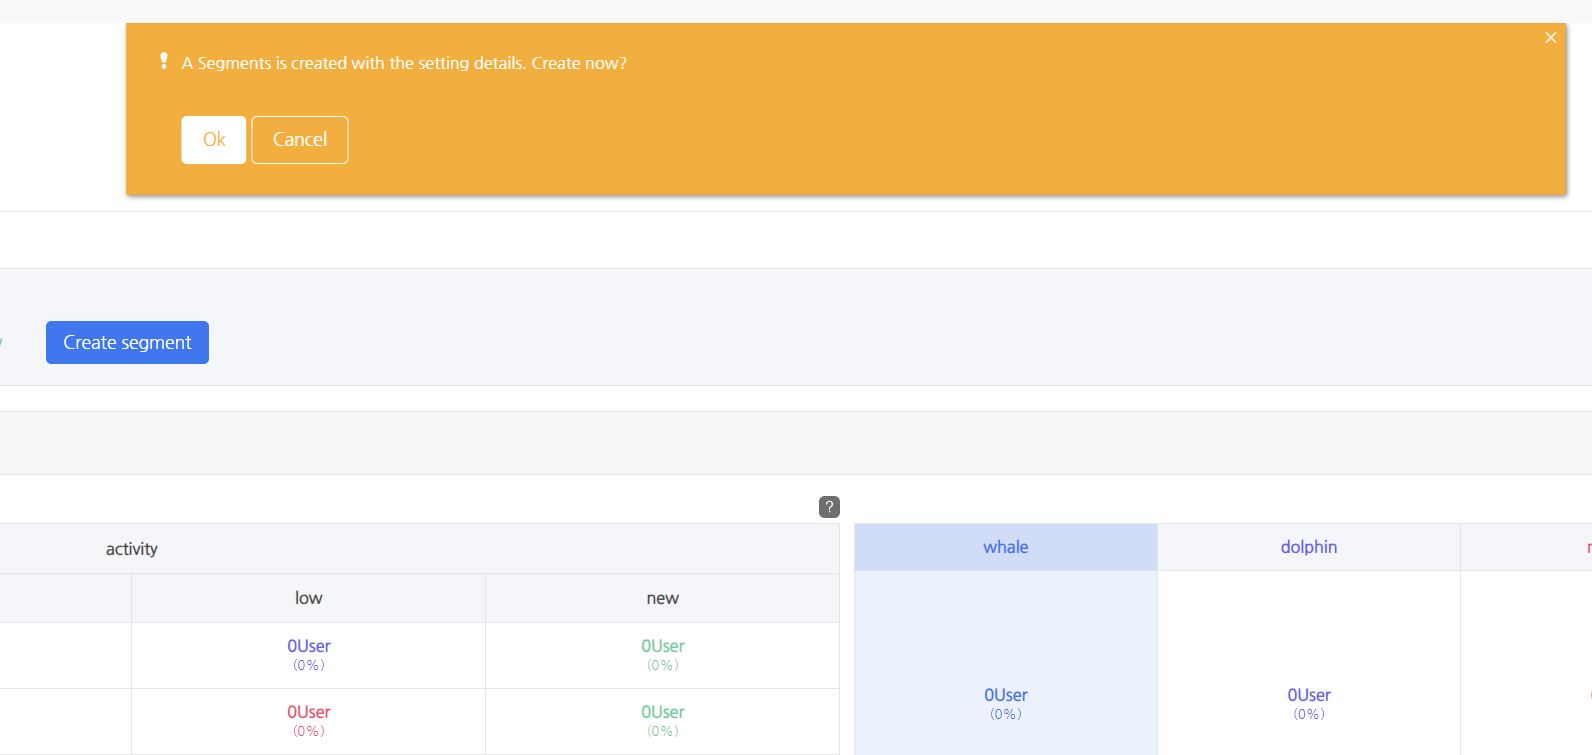
- After clicking on “OK”, click on “Go to Segment Page” to go to segment page.

- Between User Classification Type Remark and User Classification Type table, click on one or more cells that you want to target.