ROAS
- ROAS (Return On AD Spend) is an essential performance indicator (KPI) in mobile games, referring to the ratio of sales to advertising expenditures.
- ROAS = (Revenue / Ad Expense Cost) * 100
- ROAS equals 100% at the point of break-even, which occurs when sales equal advertising expenses.
- The greater the ROAS, the more effective the advertisement.
- If you run advertisements to attract new users to activate the game during game launch, update, or event periods, you can evaluate ROAS using the Analytics-provided new user LTV and NU indicators.
- You can examine the profit or loss of the advertisement that was executed.
- By comparing the figures to previous advertisements, it is possible to determine which advertisement is more effective.
- If you fall short of your performance goals, consider launching a push campaign to encourage reconnection.
Analyze ROAS with Analytics Indicators
- Check your ROAS for any period based on in-app sales via the steps below.
- Step 1: Check the cost of advertising spend per new user
- Step 2: Check advertising profit or loss through new user LTV
- New user LTV (Life Time Value): Average cumulative revenue per user over a specific time period
- Step 3: Compare ROAS by period
Details by Step
E.g.) During the period from 2023-06-24 to 2023-06-30, advertisements were conducted to attract new users, and 306,000 KRW were spent on advertisements.
- Step 1: Check the cost of advertising spend per new user
- Calculate the ad spend cost per new user in Comprehensive Indicator > Key Indicator > Daily Indicator by dividing the NU sum for the ad period (2023-06-24 to 2023-06-30) by the ad spend cost.
- Cost of ad spend per new user = Cost of ad spend / Number of new users
- E.g.) Cost of advertising per new user equals 306,000 / 306 = 1,000 KRW
- NU can also be checked in Indicator by Game > User > Overall User.
- Calculate the ad spend cost per new user in Comprehensive Indicator > Key Indicator > Daily Indicator by dividing the NU sum for the ad period (2023-06-24 to 2023-06-30) by the ad spend cost.
- Step 2: Check advertising profit or loss through new user LTV
- Compare new user LTV and advertising expenditure cost per new user during the advertising period (23-06-24 to 30-06-2023) in Game-specific Indicator > Sales > LTV.
- Indicator Interpretation

- At D+44, the LTV figure exceeds the advertising expenditure per new user. This indicates that the advertisement surpassed the threshold of break-even (ROAS of 100%) after 44 days.
- Step 3: Compare ROAS by period
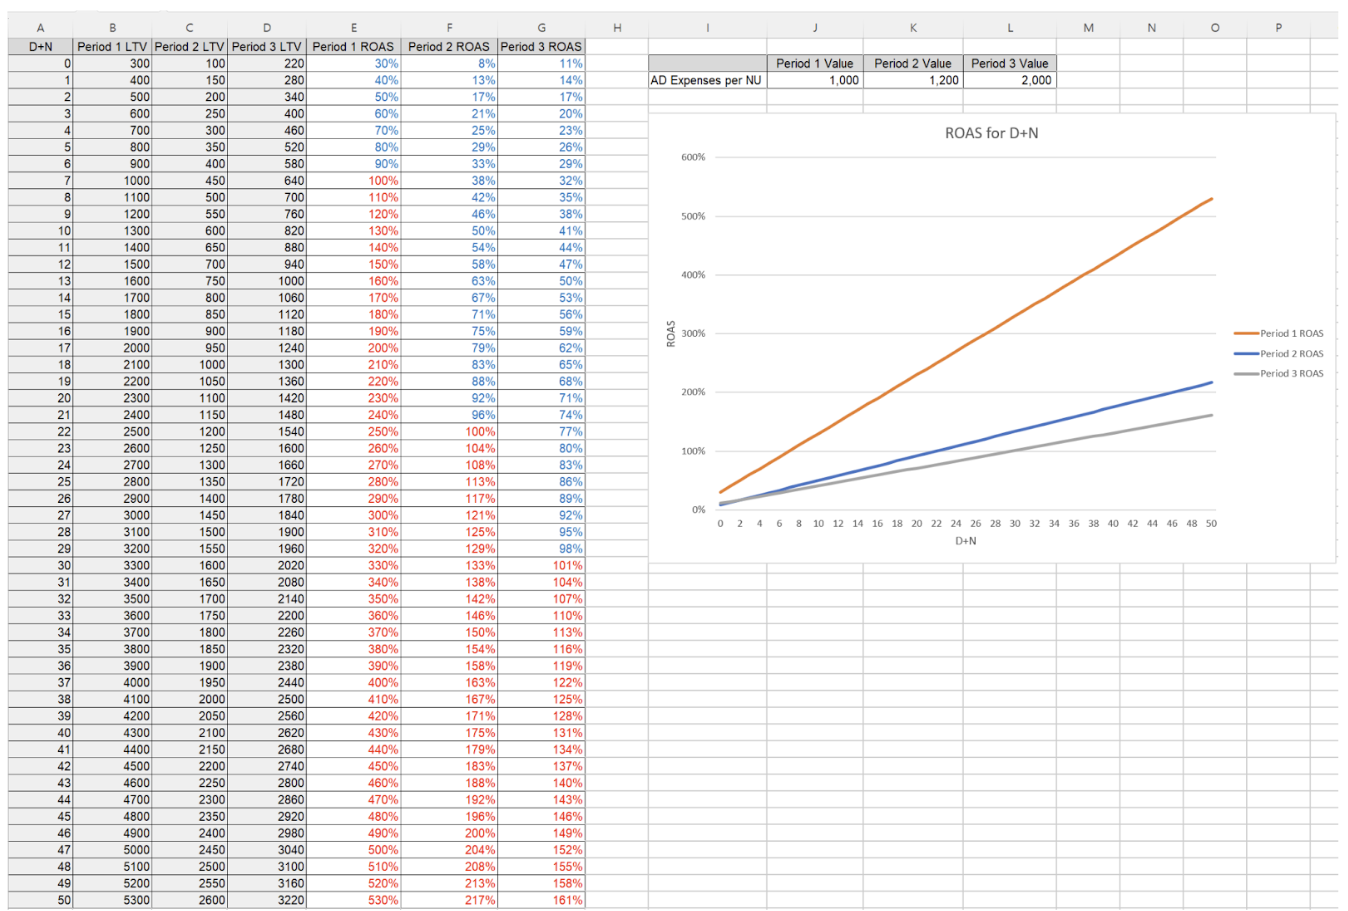
- Through advertising expenditure per new user by period and new user LTV, ROAS trends can be compared in accordance with D+N.
- Download the Excel file and input the values of new user LTV and AD Expenses per NU by period to calculate ROAS.
- Indicator Interpretation

- The advertisement executed in period 1 reached the break-even point (ROAS 100%) the quickest, and the ROAS at D+50 was greater than 500%, making it the most effective.
- If the objective ROAS is 200%, then the advertisement executed in period 3 did not meet the target, so retention analysis can be used to determine if the retention of new users introduced during that period has decreased.
- ※ New user LTV is calculated as D+N cumulative sales / number of new users with D+N. If the difference between the search period date and the search date is less than 50 days, the graph may not indicate an increase in general.
- Through advertising expenditure per new user by period and new user LTV, ROAS trends can be compared in accordance with D+N.
